A conjuntura social brasileira revisitada
Argelina Cheibub Figueiredo; Haroldo da Gama Torres; Renata Mirandola Bichir
Translated by Anthony Doyle
Translation from Novos Estudos - CEBRAP, São Paulo, n.75, p.173-183, July 2006.
This article seeks to identify the Brazilian State's efficiency in supplying “basic needs” to the poor. Taking as a guideline two surveys concerning social policies and access to public services among the poorest 40% of households in the city of São Paulo, it suggests that state action remains crucial and that the general social condition of the poor has not improved significantly since the 1980's.
Keywords: poverty; public services; social policies; the State.
RESUMO
Este artigo procura identificar o papel desempenhado pelo Estado durante os anos 1990 para assegurar a satisfação das “necessidades básicas” da população pobre no Brasil. Com base em dois surveys sobre o acesso dos 40% domicílios mais pobres da cidade de São Paulo a serviços públicos e políticas sociais, demonstra-se que a atuação do Estado continua determinante e que o quadro da situação da população mais pobre de São Paulo pouco se alterou em relação aos anos 1980.
Palavras-chave: pobreza; serviços públicos; políticas sociais; Estado.
In the article “the Brazilian Social Conjuncture”, published in this journal in 1992, in which she arrived at a measure of the nation's “social lag” through comparative analysis, Vilmar Faria stressed the role the State had performed in ensuring the provision of “basic needs” to Brazil's poor during the so-called “lost decade” of the 1980s. Speaking against “indiscriminate attacks” against the State, Vilmar issues the following warning:
]]> This analysis shows that you have to tread softly with the processional platform when the saint you carry is made of clay: as the basic needs of the poorer echelons of society are met by the public services, one has to bear in mind that if the situation is bad now, given the precariousness and inefficiency of our public social services, it would be far worse without them. These services provide the poorer population with a safety net (author's highlight). Their disorganization or even elimination, especially in a time of crisis, could have grave consequences1.
In her article, Faria argued that the decade had indeed been lost in terms of economic conditions – with stagnation and high inflation, job losses and worsening distribution of wealth -, but that the social sphere had nonetheless seen “advances” that were by no means inappreciable. The author went on to list some of the advances that occurred between 1981 and 1989: an increase in the number of school years and in literacy rates; a decrease in the number of children presenting symptoms of malnutrition; a reduction in inadequate housing and household density; and an increase in the number of households with running water, etc.
In this article we aim to show that the same can be said of the 1990s. In so doing, we shall draw upon data from two Cebrap surveys that assess the poorest 40% of households in the city of São Paulo in terms of social policies and access to public services. The first of these was conducted under the coordination of Vilmar Faria in 1991 and the second in 20042.
In the first section of this article we will present an overview of the developments in the area of employment and income generation among the municipality's poor during this period. The second section will show the levels of this population's access to basic services at these two distinct moments, with special emphasis placed on the improvement that occurred during the period 1991-2004. The third and final section will deal with the mechanisms of access to health and education available to the poor and their assessment of them.
Employment and income
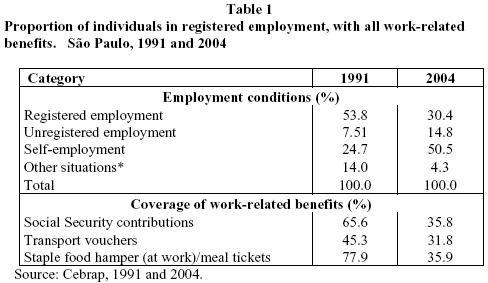
The employment curve for the poorest 40% of the population of São Paulo between 1991 and 2004 painted a discouraging picture. In addition to a sharp decrease in the size of the labour force in relation to the population of employable age, down from 57.3% in 1991 to 45.9% in 2004, work-related conditions also deteriorated substantially, as shown in Table 13.
Firstly, the percentage of the work force in registered employment dropped substantially, from 54% in 1991 to 30% in 2004. This fall in registered employment is reflected in a corresponding rise in informal employment or self-employment, both of which doubled during this same period. In fact, the percentage for self-employed individuals rose from 25% to almost 51% during this timeframe. It is important to emphasise that, contrary to the trend observed in São Paulo during the period 1940-1980, the 1990s saw a considerable drop in registered employment, indicating a high degree of “disconnection” between the poor and the jobs market, resulting in substantial negative impact on their chances of upward social mobility and integration within the contemporary urban society4.
Obviously, this downturn effected a similarly expressive decrease in access to work-related benefits. Firstly, a sharp fall in Social Security contributions was observed, sliding from 66% to 36%. This figure alone would indicate significant exclusion from such welfare benefits as income support for the sick, child support and incapacity benefit among this social stratum. The percentage of the work force receiving transport allowance also fell, slipping from 45% to 32%. This slump was even more dramatic among workers receiving a staple food hamper or meals tickets: down from 78% to 36%. Without shadow of doubt, this is a worrying panorama that reveals a marked loss of benefits and social protection within the scope of labour legislation.
The effects of this deterioration in the sphere of employment can be observed in the composition of monthly family incomes, which altered significantly within the period. In the case of men, we can see a decrease in the contribution of the main wage and a significant rise in the contribution of earnings from occasional work ('nixers' and home-based activities, as well as government transfers, such as pension payments), most likely reflecting the decrease in access to the social security system (Graph 1 below).
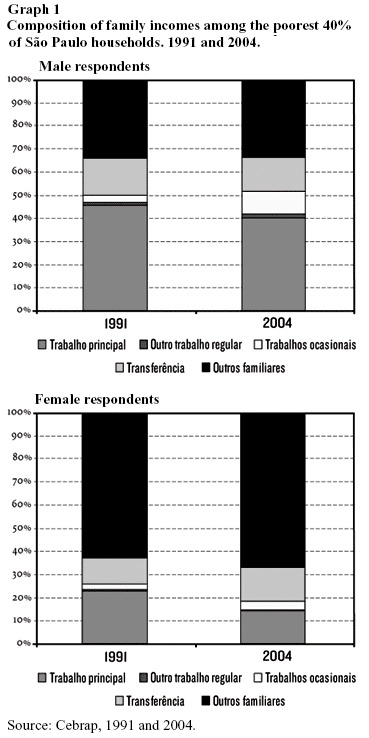
In the case of women we can also observe a decrease in the relevance of the principal wage and a significant increase in the contribution of income support. In this case, the transferred funds are not pensions, though these were less frequent in the past, but come from a greater number of social stipend programmes – like Bolsa Família (the Family Grant) -, many of which focus on female household heads.
In short, the rise in income from occasional work 'on the side' (men) and stipends (women) seems to have helped compensate for the slump in family incomes caused by the dwindling presence of the poor in the registered work force. Finding and holding down formal employment is now more precarious than it used to be and though this has severe consequences in terms of social ascension and inclusion, it may not necessarily have any major impact on total family incomes.
]]> In fact, we observed that family incomes did not seem to have been adversely affected by the increasing precariousness of employment. In 1991, the average income among the poorest 40% of the population of São Paulo city was 2.7 times the minimum wage, though this had risen to 4.2 times by 2004 (values as of November 2004)5. This means that the average income among the poorest 40% rose considerably during the period under evaluation6. It must be mentioned, however, that 1991 is a relatively problematic year insofar as it was one of the worst years in comparative terms in the average income records.
Access to durable goods
Another relevant information set concerns the possession of durable goods. This data reveals two important aspects of change in living conditions among the poorer section of the São Paulo population. Firstly, in 1991, the possession of basic durable goods – television, radio, cooker and refrigerator - was practically universal, with the single exception of the refrigerator, which, as the most expensive of these appliances, was not as widespread then as in 2004. That said, the data does show enormous growth in access to fixed line telephones and a doubling in car ownership. Secondly, this data also reveals that house sizes remained practically unchanged over the course of the decade. The average number of rooms and the number of bedrooms showed only a very slight increase. (Table 2).
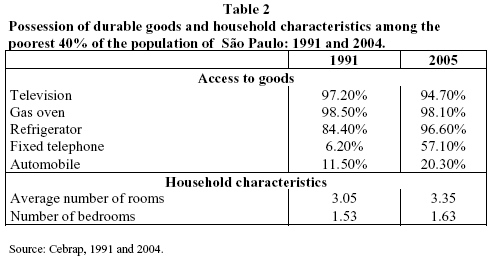
Though there is no data from 1991 to compare with, we also noted a significant presence of mobile phones in 2004 (38.3% of households), as of washing machines (37.7%), video or DVD players (31.8%) and computers (9.5%). In other words, it is clear that access to durable goods widened considerably during the period. However, it is important to note that this hike in consumer goods does not come down to increased income alone, but is also reflected in changes of consumer structure (a relative fall in food prices and the price of appliances) and the degree of credit available to the poor, both of which derive from governmental policy7.
In summary, the indicators on employment and income in São Paulo reveal considerable deterioration in access to the formal jobs market alongside a relative improvement in income and access to durable consumer goods. This overview is in-line with the national trend, although the increase in net earnings could be somewhat distorted by the fact that 1991 was one of the worst years ever in terms of average income. From 1995 to 2004, average income per capita remained practically constant, as corroborated by data from the Census Bureau.
]]>Availability of basic public services
The main aspect to note in a comparison between the public services offered to the low-income population of São Paulo is the relatively high level already achieved by 1991. As Faria suggests, the 80s would not seem to have been entirely lost in São Paulo. These services were maintained and expanded during the 90s, though they were not universalised, despite São Paulo being the richest metropolis in the country. Significant portions of the population still do have access to two public services in particular. As Table 3 shows, access to basic sanitation rose considerably, but still failed to reach a quarter of the population – a reflection of the difficulty the governors of the 90s faced in implementing investment policies. However, it was security services, the most limited in 1991, that showed the lowest levels of growth throughout the decade.
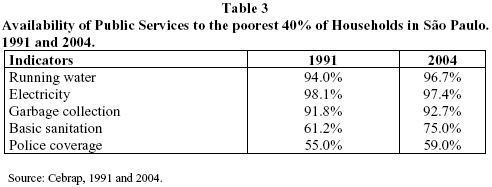
Given the precarious development of police coverage, it should be no surprise that there was a significant hike in crime rates8. Furthermore, as we shall see further on, security is generally perceived to be the most worrying problem affecting public schools.
Finally, according to the data from the 2004 survey, public schooling reached 98.7% of households (there is no correlate data for 1991), with children spending an average of 4.4 hours per day at school, though significant variations can be observed. One important difference is the type of school they attend: while pupils at municipal schools tend to spend 4.1 hours per day in the classroom, children from state schools receive a daily average of 4.8 hours of schooling. This is in keeping with state educational policy, which increased the number of class hours in primary schools, and the argument that, in addition to widening access to public services, the state has also sought to improve the quality of the services provided.
Similarly, 2004 survey data indicates that 91.0% of the poorest households in the municipality had at least one family member attended by the public health service during the last year – an expressive percentage – especially as 49.5% of those cases had occurred prior to one month before the survey. This would point to a high level of municipal public health service coverage, as less than 6% sought private health care.
]]> Comparing the two surveys, we can see that 73% of the respondents in both had used the public health service for routine check-ups (not counting emergencies) in the year prior to the survey. In 2004, the average wait for an appointment on the public health service was 39 days as opposed to 30 in 1991.In brief, data on the developmental curve for access to public services among the poorest 40% of the population of the city of São Paulo would indicate general improvement and the virtual universalization of some services. It is important to mention that these findings are consistent with those of other analyses conducted by the Census Bureau, both on a national scale and for metropolitan regions. This survey also shows that issues pertaining to service quality are likely to become increasingly relevant in discussions on unequal conditions of access to public services in Brazil9.
User assessment and access mechanisms
Both the surveys from 1991 and 2004 contained questions to gauge levels of user satisfaction with the various aspects of the public services through the attribution of scores on a scale of zero to 10. It must be stated that the evaluation made by the poorer attendees may not correspond to the expectations of the more sophisticated users of the public services, such as those with a higher level of schooling. In fact, the scores given to the various services were relatively high in both surveys, though the lower the level of schooling, the higher the scores tended to be.
In relation to primary schooling, the average score was 6.4 (on a scale of 0 to 10) in 1991, climbing to 7.7 in 2004. Unfortunately, we do not have much comparative data to help us interpret these findings, as we only have itemized scores from the 2004 survey. The breakdown is as follows: the highest average scores went to the maintenance of the school buildings (7.6), teacher attendance (7.6) and teaching quality (7.3), while the lowest scores were attributed to teacher salaries (6.4) and security (6.0). In both surveys, security is identified as the biggest problem in schools! In other words, the issue of security appears to be a fundamental and permanent factor for the low-income population, relegating educational quality to the background.
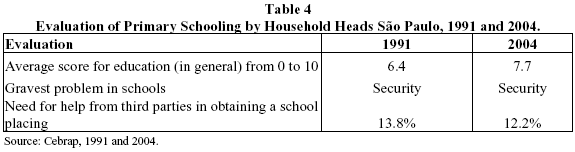
]]> Also worthy of mention is the low percentage of people alleging that they had to call upon the help of third parties in order to secure a vacancy for their children: 13.8% in 1991 and 12.2% in 2004. The survey also shows that even when people did seek help, it came from individuals within the schools themselves (teachers, directors, etc), that is, people who have an institutional duty to attend the public. This amounts to a qualitative indicator of universalization. Otherwise put, the service may not offer universal coverage, but it does reach the population, regardless of external interference, especially from politicians.
In relation to the public health service, the general assessment was lower than that for schools, but did nonetheless show a similar growth rate over figures from the 1991 survey: an increase of 1.3 in education and 1.2 in health, as shown in the table below.
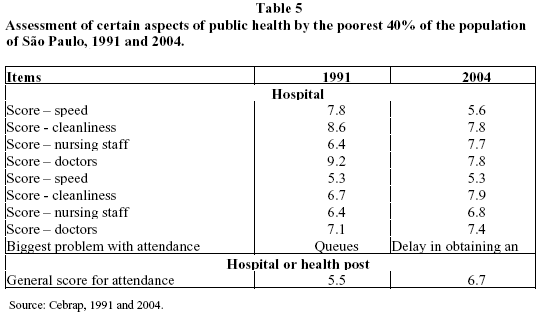
We can also see from the table above that there is significant variation among the scores attributed to different aspects of the health service. For example, while speed of attendance receives the lowest score, the doctors receive the highest marks in both surveys. As already mentioned, the 2004 survey identified an average wait of thirty-nine days for people from low-income communities to obtain an appointment, hence the poor score in the 'speed' category. Data like this denotes a consistency in the results that boosts one's confidence in the assessment, despite the argument referred to above that the poorer, less well-educated members of society tend to be less demanding in relation to public services.
In relation to income support, we must remember that, with the exception of the milk round, such programmes were practically non-existent in 1991. In 2004, 19% of the less privileged population of São Paulo had access to at least one of the income supplement programmes offered by the municipal, state or federal governments. Of those receiving such support, 50% cited the São Paulo municipal government's Renda Mínima (Minimum Income) programme; 24% mentioned federal government programmes like Bolsa Família (the Family Grant) or Bolsa Escola (School Grant), as well as domestic gas allowances and stipends for the eradication of child labour, etc; and 6.0% cited the state government's Renda Cidadão (Citizen's Income) programme. Finally, 20% of the recipient families said they were beneficiaries of more than one programme.
The most important point to take from this is that of the total number of families receiving some type of income stipend, 63% had a family income per capita of up to half the minimum wage, while 32% received between a half and one minimum wage (+/- 120 US$). In other words, 95% of those registered with these programmes are truly the poorest families in the municipality and therefore fully eligible recipients. In addition, at 14% of total monthly income, the impact of these programmes on the recipients' financial well-being is certainly appreciable. This impact is greatest amongst the poorest families, for whom the stipend accounts for 21% of total income. This becomes all the more important when we remember that the employment situation of this section of the population deteriorated drastically in the 1990s, as discussed above.
All of these programmes taken together still fall far short of attending the entire eligible population. In 2004, the coverage of these welfare programmes was still very low, reaching only 28% of the population receiving less than half the minimum wage per capita.
]]>Conclusion
Though the economy has stabilised since 1994, the plight of São Paulo's poor, as presented here, indicates that the last fifteen years have been very similar to the “lost decade” as analysed by Vilmar Faria. In summary form, the main observations are:
Access to the jobs market has deteriorated further, with the percentage of São Paulo's poor engaged in formal employment having become a clear minority, with obvious adverse consequences in terms of economic opportunities for these families;
As for the composition of family incomes, the participation of the principal wage has fallen while the contribution of sporadic work and governmental benefits has risen (especially for women);
Income growth demonstrated relative improvement, though it must be remembered that 1991 is a problematic year in comparative terms. According to Census Bureau data, average family income per capita remained practically stable between 1995 and 2004, whilst the number of those living below the poverty line increased;
Access to income supplement programmes has assumed a weighty significance in the income composition of poorer households.
Thinking about the next few years, it has to be said that the outlook for the poor in terms of employment is far from encouraging. The private sector is not showing signs that it will be capable of generating jobs for the poorer segments of the population in the near future. Whether due to low growth rates or the effects of new technologies, companies are offering fewer and fewer jobs and requiring higher qualifications when they do. On the other hand, stimulating the generation of employment for the less skilled workforce, for example, in such large-scale employers as civil construction, does not seem to have been a priority in economic policy in recent years. In short, there is little hope of any real advances being obtained in terms of employment prospects for the poor.
While the State has managed to “soften” the impact of the steady deterioration in employment conditions for the poor through social policies and public services, it must be asked how much longer it will be able to sustain itself in this role. On one hand, the state's fiscal capacity to expand the social safety net has been put in check by increasing public expenditure and debt. On the other hand, the positive effects of this demographic transition – which has eased the pressure of demand on the educational and health services – have largely already been felt, opening space for new and daunting challenges to social policy, such as the aging population.
Received for publication on June 04, 2006.
]]>
Argelina Cheibub Figueiredo, Haroldo da Gama Torres and Renata Mirandola Bichir are researchers at Cebrap.
1 Faria, V. “A Conjuntura Social Brasileira: Dilemas e Perspectivas”. In: Novos Estudos Cebrap, n. 33, July 1992.
2 Figueiredo, A., Torres, H, Limongi, F., Arretche, M., & Bichir, R. (2005). Relatório final do “Projeto BRA/04/052 - Rede de Pesquisa e Desenvolvimento de Políticas Públicas: REDE-IPEA II”. Mimeo.
3Two different indicators are normally used to evaluate the conjuncture in employment studies: employment rates (the total labour force against the economically active population) and the activity rate, which compares the economically active population (persons above the age of 10 who are currently employed) against the population of active age (persons above the age of 10). Due to problems of compatibility between these two surveys, we have only considered the relation between the work force and persons of active age.
4 Kaztman, R. e Retamoso, A. (2005). “Spatial segregation, employment and poverty in Montevideo”. In: CEPAL Review n. 85, April 2005, pp. 125-141.
5 The values for 1991 were adjusted for inflation as per the FIPE (Economic Research Institute Foundation) index, with due currency conversion from Cruzeiro to Real.
6 Unfortunately, we were unable to make a direct comparison between the average incomes observed for the respondents in both surveys due to problems in weighing the 1991 sample.
7 Torres, H.G., Bichir, R.M. e Carpim, T.P. (2006). “Uma pobreza diferente?”. In: Novos Estudos Cebrap, n. 74, pp. 17-24.
8 The number of deaths by violent crime in the state of São Paulo more than doubled over the course of the 90s (according to figures from Fundação Seade [the state data analysis system foundation]), though crime-related deaths have fallen slightly since 2003. ]]>
9 See Figueiredo et al, 2005, op. cit.