Integrando desenhos e imagens de satélite no estudo de mudanças no uso e cobertura da terra
Álvaro de Oliveira D'AntonaI,II; Anthony Daniel CakIII; Thais Tartalha do NascimentoIV
IFaculdade de Ciências Aplicadas FCA, Universidade Estadual de Campinas Unicamp
IINúcleo de Estudos de População NEPO, Universidade Estadual de Campinas Unicamp
IIIAnthropological Center for Training and Research on Global Environmental Change, ACT/Indiana University
IVInstituto de Filosofia e Ciências Humanas IFCH, Universidade Estadual de Campinas Unicamp
Translated by Anthony Daniel Cak
Translation from Ambiente & sociedade, Campinas, v.11, n.1, p.99-116, Jan./June 2008.
ABSTRACT
We analyzed the procedure of collecting and processing information in regard to land use and land coverage obtained from sketch maps created together with rural property owners in a settlement area along the Transamazonica, the Transamazon Highway, in Pará, Brazil. We assessed the special features of field data and integrated them with data from satellites. We concluded that these sketch maps can be used systematically to improve interdisciplinary approaches in the study of environmental changes.
Keywords: Amazonia. Change of land use and land coverage. Sketch maps. Methodology.
RESUMO
]]> Analisamos o procedimento de coleta e processamento de informações sobre uso e cobertura da terra, obtidas por desenhos feitos com moradores de lotes rurais, em um segmento da Rodovia Transamazônica, no Pará. Consideramos as peculiaridades dos dados de campo buscando integrá-los aos dados obtidos por satélite. Concluímos que o instrumento deve ser usado sistematicamente no aprimoramento de abordagens interdisciplinares para o estudo de mudanças ambientais.Palavras-chave: Amazônia. Mudanças no uso e na cobertura da terra. Desenhos. Metodologia.
1. Introduction
Development of new research methodologies and interdisciplinary research constitute significant elements in studies focused on the research theme of the interface between society and the environment. Analyses of land use and land cover change that use remote sensing and geographic information systems (GIS) are examples where novel methodology combining different types of data sources, such as interviews with small farmers and satellite imagery, is essential for obtaining a fuller understanding of the interactions between socioeconomic and biophysical elements (MAUSEL et al., 1993).
Research of land use and land cover change using remote sensing was initially limited to biophysical and computational science applications. These initial investigations using remote sensing technology originally emphasized physical processes and chemical or environmental changes, such as large-scale atmospheric changes and other biological phenomena (CONANT, 1990). However, more recent research has demonstrated the importance of combining social science and ecology with remote sensing technology (LIVERMAN et al., 1998). Consequently, many studies have shifted to include research perspectives that are more sensitive to socioeconomic and demographic processes related to land cover change. Additionally, the scale of analysis has shifted; incorporating methods from the social sciences to study the behavior of small-scale producers on their lots has led to the development of micro level analysis as an analytical perspective. This perspective, such as that at the level of the household or rural lot, has been found to be compatible even with other, more general analytical perspectives, such as that which can be found in remote sensing analyses (MORAN; BRONDIZIO, 1998; BROWDER, 2002; CASTRO et al., 2002; EVANS et al., 2002; GUTMAN et al., 2004; MORAN et al., 2005a).
The present text contributes to the improvement of interdisciplinary methods to study land use and land cover change that integrate local knowledge about the environment with conventional remote sensing research approaches, which allows for different perspectives to be included in one unique, georeferenced analytical system. As such, spatial descriptions (sketches, sketch maps) of rural properties are used in this work to access and represent the understanding of local, small farmers residing in the area along the Transamazon Highway in the state of Pará, Brazil. We present the procedures used to collect, process, and analyze information obtained from sketches. We also consider the classification of land use and land cover identified in the sketches in relation to classification of land cover identified in satellite imagery, typically used in studies of environmental change, thereby allowing us to respond to several fundamental questions related to the methodology we describe here: is information described by local residents different from data obtained in the laboratory, and for what reasons? Are these results simply incompatible or are they complementary sources of information?
This exercise reveals particular ways of viewing and representing the local environment. The categorization made by local residents, in general, is rich in detail (dirty pasture, old secondary regrowth, new cacao, subsistence crops) and is based on their day-to-day experiences of living on and using the land. In contrast, a laboratory-based approach using satellite imagery is not constrained by subjectivity and interpretation errors, but is constrained by the spectral behavior of pixels of the image to obtain land cover classes that correspond to vegetation structure and physical and environmental parameters (bare soil, secondary succession). The goal of this paper is to demonstrate a tool for dealing with symmetric data sources with different perspectives and categories, one emphasizing land use and the other land cover. Such a tool also facilitates the transfer of knowledge between local residents and research technicians and scientists, beyond the creation of interdisciplinary work opportunities. This exercise also can give value to the perception that local residents have about the environment in which they live, particularly the ways in which they classify land use and land cover, which is an important step not only for improving the classification of satellite images, but also for including voices that are not always considered in scientific analysis.
]]> 2. Land use and land cover
Remote sensing has become an important tool for characterizing and analyzing landscapes, especially in tropical ecosystems (MORAN et al., 1994; MORAN; BRONDIZIO, 1998; WOOD et al., 2002). Studies in the Amazon have used this tool to document changes in land cover in order to infer changes in land use (MORAN et al., 1994; BOUCEK; MORAN, 2004; SOARES-FILHO et al., 2004). Remote sensing data has been shown to be useful for fieldwork and planning, especially in study design, even in situations with limited budget and time to implement fieldwork (CASTRO et al., 2002).
Information about changes in land use and land cover typically has been collected at the scale of the household unit and the rural property (MORAN; BRONDIZIO, 1998). The georeferencing of socioeconomic and demographic data, obtained by quantitative research (surveys), and vegetation data, obtained empirically, has allowed for these data sets to be inserted into a GIS and combined with other types of data, such as satellite images and maps of rural property boundaries, such as those developed by the Brazilian National Institute for Colonization and Agrarian Reform (INCRA) (MORAN, 2000; ENTWISLE et al., 2005; MORAN et al., 2005b).
The integrated use of information collected in the field and in the lab allows for multi-temporal analysis at different levels of scale and data aggregation, especially the relationship between households and their territorial units, such as lots and rural properties where households are located, and for the spatial distribution and analysis of socioeconomic and biophysical data (PICHON; BILSBORROW, 1992; MORAN et al., 1994; WALSH et al., 2001; BRONDIZIO et al., 2002; MORAN et al., 2003; MORAN et al., 2005b). The spatial georeferencing of rural properties and households allows for the relation of data collected in the field with information from each pixel (point) of a satellite image the smallest area for which information is available from the reflectance of light on the surface of the earth. Thus, what was just a composite image of a collection of points with different reflectance, or color, can represent a system with various aspects that relate to land cover (LIVERMAN et al., 1998; BRONDIZIO, 2005).
In the process of integrating field data with satellite data, being able to differentiate between land use and land cover becomes critical for understanding changes in the landscape. Land cover includes natural elements of the landscape, such as areas covered with vegetation and areas with human communities and infrastructure (VANWEY et al., 2005). On the other hand, land use implies a relationship between elements of land cover and their importance for individuals and institutions, and is typically deduced through the understanding of changes in land cover (LAMBIN et al., 2003). For example, in defining an area as a quintal (yard), this area is given a significance and meaning for those living on a rural property, yet, the same area can consist of different types of soil, vegetation, or land cover (MORAN; BRONDIZIO, 1998).
To better understand these distinctions, information on land use and land cover used in the classification of satellite images is typically obtained through fieldwork, which has involved field verification (ground truth), quantitative research (surveys), and interviews with residents of rural properties (MORAN et al., 1994; MORAN; BRONDIZIO, 1998; TUCKER et al., 1998; BOUCEK; MORAN, 2004). The information obtained from these instruments thus is used to generate a supervised classification of a satellite image and the development of a land cover classification system based on measurements made in the field to identify the types of land cover that correspond to each type and color of pixel (LU et al., 2003; LU et al., 2004a).
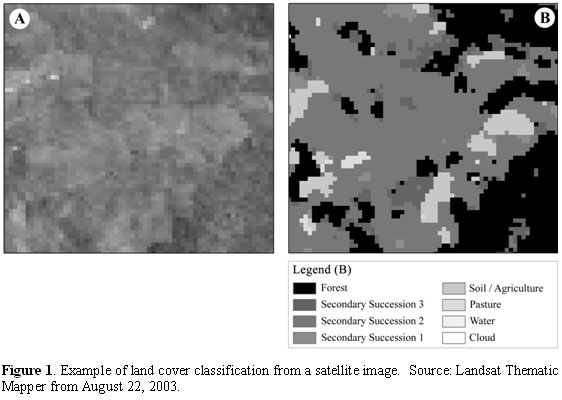
In the classification, the original reflectance value of each pixel (Figure 1a) corresponds to a particular class or type of land cover (Figure 1b). Based on previous experiences of land cover classification in Amazônia (MAUSEL et al., 1993; LU et al., 2004b; LU et al., 2005), for the current work, we used a hybrid supervised and unsupervised approach for classification of Landsat TM satellite images collected in 1998 and 2005. We developed eight classes of land use and land cover for image classification and for comparative testing of property sketch maps, namely: 1) forest, which signified areas with a high density of large trees, 2) three levels of secondary succession, which account for a gradient of fallow areas (the third, highest secondary succession class corresponds to vegetation regrowth that is very dense and large, while the first, lowest class describes vegetation that is less dense and smaller), 3) soil/agriculture, with areas without forest cover, mostly agricultural use or exposed soil, 4) pasture, with areas covered by undergrowth, generally functioning as pasture, 5) water, including water bodies such as river, streams, and dams, and 6) cloud/cloud shadow, or areas without data for land cover. These classes correspond to the characteristics of the landscape of the study area in Altamira, in the state of Pará, but can be aggregated for comparison with other areas in more general or regional studies (BRONDIZIO, 2005).
While fieldwork is recognized to be important to improve the classification of satellite images, consideration also should be given to the types of problems and limitations inherent in this type of data collection. Previous experiences have shown that information on land use and land cover obtained from questionnaires and interviews is very dependent on the memory of respondents and the ability of interviewers to obtain accurate information (MORAN et al., 1994; MORAN; BRONDIZIO, 1998; TUCKER et al., 1998; BOUCEK; MORAN, 2004). Thus, information on the history of land use from more recent periods is likely to be remembered by farmers with greater precision and accuracy than information about earlier periods, or about cultivated areas they consider to be less important. For example, a plot of manioc used only for consumption by the farmers family and not for sale to the market may be forgotten and ignored during the interview, even though it is an important cultivated area. Different classification systems, hierarchies, and units of measure used by the interviewees also can create difficulties in the collection and recording of answers: in the Amazon, land cover can be defined, for example, in spatial units such as the alqueire, hectare, tarefa, and braça, which can vary depending on the understanding and place of origin of each interviewee.
In addition, information collected from questionnaires does not always generate a significant level of detail, or, in other words, information about the resolution and location of land cover on the property. For example, a collection of tables in each questionnaire may document the dimensions of each type of land cover on the property, describing 50 ha of pasture, 2 ha of manioc, 20 ha of secondary regrowth, and 30 ha of forest; however, it is difficult to define the exact location where each cover occurs. This is certainly a source of problems in the classification and analysis of satellite images, as well as limiting the capacity to understand the internal dynamics of the rural property, such as the mechanisms of crop rotation, including areas in use and in fallow (BRONDIZIO, 2005). However, these difficulties are not derived exclusively from the subjectivity of field data.
The analysis of satellite images also may be hampered by their own instrumental limitations, such as image resolution and the type of information collected by the satellite (RINDFUSS et al., 1998; GIBSON et al., 2000).
This type of work also can be affected by problems related to the scale, resolution, and misclassification of an image. The Landsat 5 TM satellite, for example, provides data with a resolution of 30 by 30 m, with each point representing an area of 900 m2, and provides data across the electromagnetic spectrum, divided into six band resolutions, such as blue, green, and red. The 30 by 30 m resolution could potentially limit certain types of analysis, especially in analysis where changes occur in areas smaller than one pixel. These areas can include significant elements in the life and productivity of small farmers, such as small roças (gardens) and infrastructure. Additionally, similar reflectance values in the six distinct bands of the Landsat 5 TM sensor for different elements can confound the identification and classification of image pixels. For example, areas with cacao agroforestry are usually classified as areas of secondary succession due to their similarities in vegetation structure, such as tree size and density, with areas of forest regeneration. The similar pixel reflectance values, in these two cases, constitute essentially different means of production and income for the farmer, with productive cacao agroforestry areas being mistaken for areas in fallow (LI et al., 1994, MORAN; BRONDIZIO, 1998; CHOKALINGAM; De JONG, 2001).
One method that may help to locate different types of land cover and other spatial information that is particularly important from the perspective of the household unit and the associated rural property is the use of sketch maps in support of questionnaires and interviews. Sketches made with the help of interview respondents, such as those seen in work done by the Anthropological Center for Training and Research on Global Environmental Change at Indiana University and also by the George Perkins Marsh Institute & Graduate School of Geography at Clark University (McCRACKEN et al., 1999; GEOGHEGAN et al., 2001; TURNER et al., 2001; MORAN et al., 2003; TURNER et al., 2004; BRONDIZIO, 2005; MORAN et al., 2005b) can provide greater understanding of current land use, as well as provide a spatial understanding of past land use, which can allow for knowledge of how farmers manage their properties over time.
Sketches also can be used to refine the interpretation and understanding of the satellite image pixels in relation to the visualization of land cover and land use from the perspective of the local resident. However, this tool previously has only been used as a complement to other types of data collection (e.g., surveys, questionnaires). Few studies have assessed the way in which information about land cover, obtained from sketch maps, can be related to data obtained through the classification of satellite images. Additionally, studies often have neglected this type of map drawing as an expression of local knowledge about the environment, similar to other types of visual recording techniques used by the social sciences, particularly those used in anthropology to understand logic and local categorization schemes (FELDMAN-BIANCO; LEITE, 1998; NIEMEYER, 1998; ALVES, 2004). In this work, we assessed the way to symmetrically pair two data sources that express unique knowledge about the environment from different perspectives: sketch maps created in the field and satellite images, resulting in a work that is not just a method to enhance the classification of satellite images.
3. Data Collection
3.1 Fieldwork
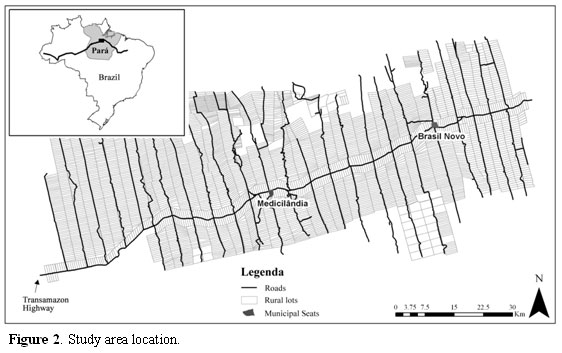
]]> Data was collected between July and October 2005 in interviews with residents of rural farm lots located in a colonization area first occupied at the end of the 1960s. The study area (Figure 2) includes the Transamazon Highway (BR-230) and its secondary roads, known locally as travessões (feeder roads), between the municipalities of Altamira and Uruará, in the state of Pará. With an area of approximately 578,000 ha, the study area includes the municipal seats of Medicilândia and Brasil Novo, along with agrovilas (small urban outposts) and approximately 3,916 rural lots, according to data from the Brazilian Institute of Colonization and Agricultural Reform (INCRA). Even though the study area includes urban areas, the area and its surroundings are predominantly rural.
Fieldwork undertaken in 2005 looked to identify environmental, socioeconomic, and demographic changes that occurred in a sample of 402 rural lots originally visited between 1997-1998. In these same lots in 2005, information was collected about the lots, such as land cover, about the domestic households there in 1997-1998 and 2005, such as composition and the relationship between each study period, and about the individuals that were part of the study in 2005 and in 1997-1998.
3.2 Research tools
The research tools used in this fieldwork included 1) a collection of questionnaires, 2) maps, 3) satellite images, and 4) a method for spatially describing each visited lot that used a sketch of the property made by each interviewer, with the help of those being interviewed.
At the start of the interview, a map (44 x 91 cm, with a scale of 1:160,000) of the entire study area was shown to the residents of the lot. The map showed the urban centers and roads overlaid on a satellite image of land cover acquired in 2003 (Landsat 5 TM, acquired on August 22, 2003). These components served to contextualize the research and locate the interviewed property in the study area. They also served as an introduction to the essential information needed for understanding the satellite image, thereby allowing the interviewees to interpret the map and to relate and explain forest cover transformations, above all deforestation, in the study area.
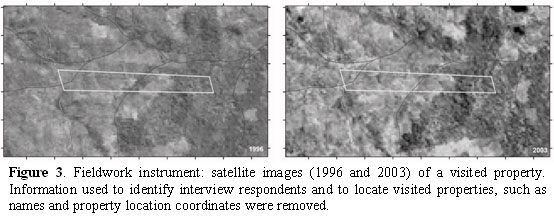
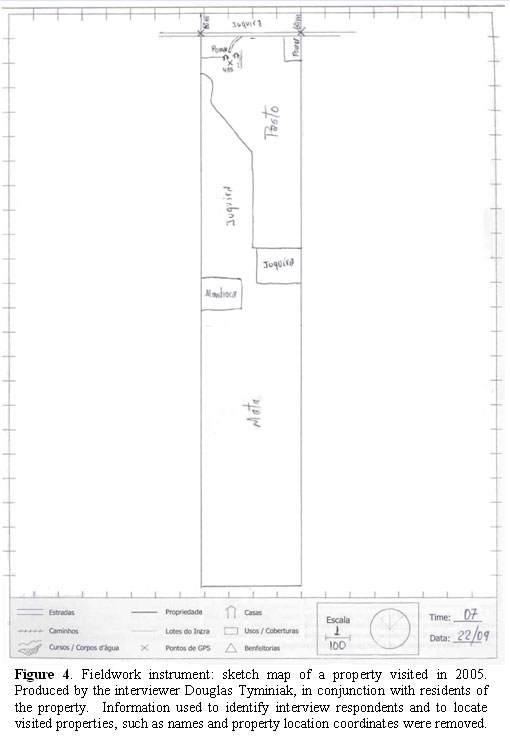
During the application of questionnaires about land use to the heads of household of the study properties, two instruments were used to increase the understanding of lot dynamics: one 21 x 25 cm sheet with satellite images of the lot in 1996 and 2003, at the scale of 1:24,000 (Figure 3), and a sheet for drawing and spatially describing the lot, including the property boundaries, principal components, such as houses and other structures, and land uses, along with waterways, forest, pasture, and cultivated areas (Figure 4).
]]>
These instruments were used simultaneously. The interviewer moved between each one during the conversation with the interviewee, always looking to relate the information described in the sketch with the images and responses to the survey questionnaire. For the creation of the spatial description of the lot, several standards were adopted, such as a uniform and representative scale and orientation of the elements represented in the sketches, that, described with spatial coordinates gathered using Global Positioning System (GPS) devices, guaranteed the comparability of sketches between each other, even those made by different people, while also allowing the same sketches to be compared against georeferenced information.
Principally used to access the history of land use and occupation of the properties, sketch map drawings of the lots also allowed for the ability to understand and observe how residents manifested their understandings of the region and the lots in which they live. Used reflexively, these survey instruments strengthened the contact between the interviewers and the interviewees, as well as served other functions, such as, for example, in capturing the way such instruments were being understood by the residents, and, above all, in how they described spatial orientation, and notions of scale and proportion. Thus, it was not only important which types of data were being collected along with the images and the maps, but also how information was being communicated between the two parties.
]]> The experience of elaborating these spatial descriptions of the property, based on the perceptions by the residents of the land use and land cover in the places where they live and produce, constituted a strong form of interaction during the interviews; it was an easy and effective instrument for the exchange of information, and a good example of a type of ethnographic encounter. This made the process of creating sketch maps distinct among the classical standards of information gathering, such as those of Evans-Pritchard (1993), including the experience of an ethnographic encounter, or an event with interaction and dialogue, where forms of social and spatial organization are understood (SAHLINS, 1997) and transcribed on paper.3.3. Reading maps and images; designing the rural lot
When presented with a map of the study area, many of the interviewees were not able to understand it by virtue of not identifying familiar elements in it and/or the difficulty in perceiving the scale of elements that were represented in the map. In some cases, the map was initially perceived to represent the whole of Amazonia or even the whole of Brazil, but after explanation and location of map elements such as urban centers, the residents had a better understanding and ability to interpret the major components of the map, including the establishment of relationships between locations and the distance and proportion between places.
The most common problem in the use of this instrument occurred in the way interviewers and interviewees oriented themselves in space. The map of the region included an arrow pointing to the geographic north, which was always used by the interviewers to orient themselves. However, for the residents, the north arrow was not always the primary element used in positioning the map. In the positioning and reading of the map, the interviewees oriented themselves according to their location relative to the Transamazon Highway, as well as the cities and travessões (feeder roads), in a relatively similar way that the interviewees situated themselves individually in the study area as a whole. Above all, in properties located along travessões to the south of the Transamazon Highway, it was common for the map to be read with the north arrow pointing south, so that the colonists positioned the Transamazon Highway to their backs. This caused confusion between the interviewers and interviewees, but it showed that the point of view of the interviewees was perfectly coherent, even with the south part of the map pointing to the geographic north, and that the interviewees were able to adequately use the instrument.
In relation to the gradation and the different colors that were adopted to represent land cover on the map, in a large number of interviews, the association of colors with the type of land cover representing soil was understood fairly quickly. This was most common in identification of the color red in relation to the existence of large cattle ranches in the area near Altamira. In some cases, before the interviewers explained the significance of the colors of the satellite image, the residents already were asking if red areas on the map were related to areas that were deforested for pasture. However, the gradation of the color green on the map caused problems for the residents, who were not as able to quickly identify the meaning of the different hues.
For the residents, understanding the map meant that it could be used to relate the history of the region through their own eyes and own interests. Locating areas with good soils, areas with or without water, and productive areas in each location helped to understand how the region was occupied and why. Once informed about the elements of the map, the resident was able to comment about them, mentioning deforestation and production in the region. Many were nervous or worried in seeing that the region was deforested. For others, there was a mixture of astonishment in the extent of deforestation since their arrival to the region and the rapidity with which it occurred.
In looking at an image of their lots (Figure 3), some residents found it difficult to associate the polygons as representing their properties, while for others the understanding was almost immediate. Just as with the regional map described above, the colonist needed to orient him- or herself in relation to the position of the travessão that passed in front of his/her lot and also by his/her position relative to the Transamazon Highway. Significant elements in the images, such as a large deforested area or a stream, also helped the interviewees in understanding the orientation and scale of the figure. Once familiar with the image, the residents were able to correct eventual problems with the maps presented to them, such as imprecise limits or incorrect positioning of the lot in relation to access roads, which in itself expresses the relevance of local knowledge for the further improvement of georeferenced information.
Additionally, similar to the presentation of the large map described above, residents often rapidly understood the significance of the colors of the map showing their lots. Deforested areas, plantations, abandoned areas, and even those areas maintained as forest along the roads to cover deforestation within the lot were apparent in the image, often to the astonishment of the resident. Many of the interviewees did not have an exact notion of how the property was used over time. Several interviewees were embarrassed to see that the uses they have undertaken on their properties appeared in the image. In some cases, they refused to admit that they were using areas greater than half of the property or, if they did, they insisted in saying that they had forest reserves to demonstrate that they did not disobey environmental laws. Whenever there was a clash between what residents said and what appeared in the images, alternative means of capturing information about land use on the lot were sought without constraining the interviewee and without compromising the type of response obtained in the questionnaire and in the sketch map of the lot.
In working with the sketch of the property, residents often needed time to transition between the different instruments, particularly those with different scales. That required the attention of the interviewers, so that the location and the dimensions of the elements described by the colonists, included in the design, were able to correspond to reality. In the process of making the sketches, the current and historical use of each part of the lot was delineated. The satellite images gave the parameters needed to identify the changes in land cover, while the data reported by the residents explained how each area had been use and what had been done since then. When composing the sketch, the interviewers asked about uses within certain parts of the lot, including what was made, planted, harvested, cared for, and the motivations for the use or non-use of each area. To a large extent, these activities and uses were contextualized by the life history of the residents of each lot, which enriched the understanding of spatial organization and dynamics of the property.
In general, interactions between the information obtained by visual interpretation of the satellite images and from the accounts related by the residents brought details about the use and land cover in the region. In addition, they provided a lively discussion that was interesting and rewarding for both interviewees and interviewers, since both parties were able to effectively exchange information and learn from each other.
]]>4 Processing and analyzing the data
4.1 Georeferencing and classification of the spatial descriptions of the lot
The spatial descriptions, combined with the satellite images, required, a priori, the acknowledgement of the limitations and advantages of using both data sources, and the subjectivity of the technical and scientific tools against the objectivity of the sketches. On the one hand, it was necessary to qualify the pixel and to question its truth status; just as the sketch map, the satellite image also was a representation that was subject to interpretations and inaccuracies, even if its scientific status granted it credibility and rigidity that is, often times, incontestable. Moreover, it was necessary to recognize that despite being subjected to problems in the interaction between interviewers and their interviewees, the sketch maps provided objective information that could be used in a manner consistent with the use of satellite images.
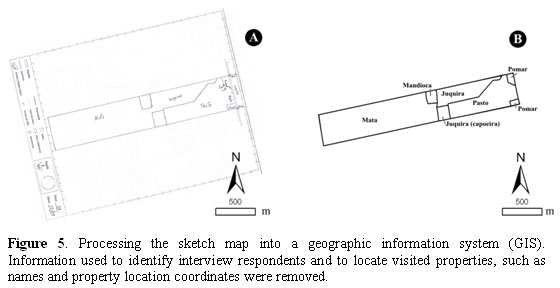
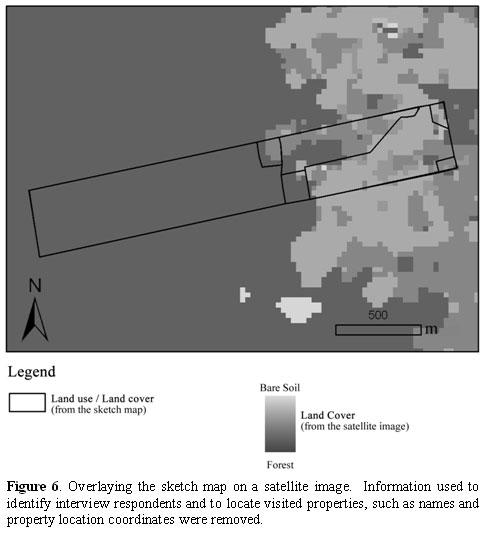
Based on these assumptions, a sample of sketches considered appropriate was used in the creation and testing of mechanisms to compare and relate the two data sources, with the objectives of 1) incorporating the information contained in the drawings into a GIS, 2) classifying the land uses and land cover found in such sketches, and 3) identifying situations where the use of the sketches could serve to improve the results obtained from satellite images. The large map of properties in the study area was divided into six equidistant quadrants along the Transamazon Highway. Sketch maps were selected from each quadrant, according to the clarity and diversity of the types of land use reported in each one, such as the presence of pasture, cacao plantations, forests, and secondary succession areas. A total of 42 sketch maps were selected, scanned, and then georeferenced (Figure 5) using ArcGIS 9.1 (ESRI, Redlands, CA, USA). Through georeferencing, it was possible to insert the field data into the GIS so that the limits of the properties defined in the sketch maps could be converted into vector polygons. The digitized property limit polygons were then adjusted to the limits of the INCRA property grid within the GIS, taking into account coordinates, or GPS points collected by the interviewers in the field, of the property boundaries and household locations. In this process, spatial error between the boundaries of the INCRA property grid and the digitized property boundaries from the sketch maps was less than 10 m, which is less than one pixel for many satellite sensors, such as Landsat, which has a pixel size of 30 m, thus attesting to the overall quality of the processing and data collection. Following this step, each type of land use and land cover drawn in the sketch maps was converted into vector polygons, resulting in the complete digitization and vectorization of the elements found in the sketch maps (Figure 5b). The spatial information and landscape description included in the GIS would thus be able to be overlaid with other sources of spatial information, such as classified satellite images showing different classes of land cover (Figure 6).
]]>
With the objective of defining a set of categories comparable to those classes obtained from satellite images, we performed successive tests on the classification of polygons created from the sketch maps. The main challenge was to reconcile the two data sets; the system of classification of the local residents often emphasized land use, and not necessarily the types of land cover, unlike the system of classification generated from satellite images, in which the type and extent of land cover is emphasized, with the corresponding land use inferred from the land cover. For example, one resident affirmed that a certain portion of his property was pasture, but from observations made on site, along with confirmation from the satellite images, it was found that the area was covered by low-density secondary vegetation. This divergence with respect to satellite data could be considered a type of error in data collected from the field, or possibly interpreted as ignorance of the local resident. Either interpretation was perfectly justifiable; for the resident, what was important was that the area used as pasture for cattle was either completely clean, in that it only had grass, or that it was dirty, in that it had pasture with trees.
The use of adjectives, such as clean and dirty, according to local nomenclature, allowed for the breakdown of broad land use and land cover categories, such as pasture, into more detailed categories, thereby allowing for the possibility of improvement in the system of classification generated from the satellite image. In some situations, the adjectives of the type of land use included time classes, which allowed for the possibility of sketches to be used recursively to help in the classification of older satellite images. For example, areas classified as cacao agroforestry or secondary regrowth could be differentiated by age: into 2-year old cacao agroforestry, or areas that were planted 2 years ago, 8-year old cacao agroforestry, or secondary succession that can be differentiated between new and old areas.
This richness of details gave value to the sketches, since it added features that would be difficult to detect through the exclusive use of one or several satellite images. In the case of dirty pasture, as in areas of cacao agroforestry, what would have appeared in a satellite image as secondary regrowth, a class generally associated as unused and set-aside, could have been correctly identified according to the uses identified by the residents.
These exercises showed that these types of land use could be arranged and rearranged to represent classes of varying complexity and to represent classes over time, so that different classifications could be used to face particular problems and specific issues. Among the various possibilities included the use of sketches to differentiate between the generic land cover class described as secondary succession into classes that were more representative or particularly emphasized. Not only was secondary succession an important class for understanding the system of production based on crop rotation (e.g., areas of fallow), it also represented a reoccurring problem in conventional analysis: the confusion, in this type of land cover, between areas in use and areas in fallow. The incorporation of sketches and visual analysis of the sketch images was sufficient to show, in the classification of secondary succession, the major divergences between the sketches and the images and, consequently, the most obvious possibilities to improve the results.
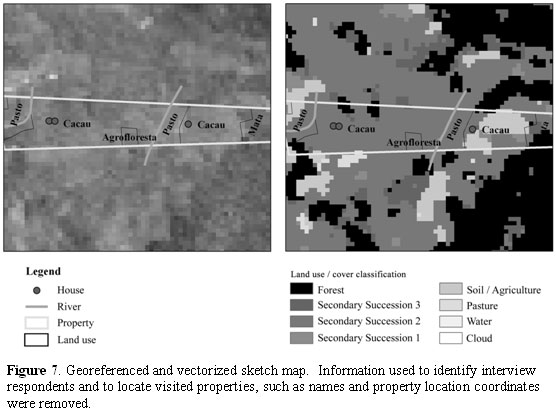
Figure 7 demonstrates how classification based on the sketch of the property could be superimposed on a satellite image (a), and superimposed on the same image classified with different land cover classes (b). This figure illustrates the problem of classification of secondary succession areas: in what appeared to be classified in the satellite image as secondary succession areas, according to data from the field, was actually a cacao agroforestry plantation. The divergence shown in this figure was repeated systematically in the sketches we analyzed, documenting a situation that was common during fieldwork.
]]>
4.2 Responding to the questions
The experience of comparing the sketch maps to the satellite images allowed us to be able to respond to the questions posed at the beginning of the text.
In relation to the first question to what extent does the information provided by the respondents differ from the data collected in the laboratory, and for what reasons? we found that there are differences between the two sources of data, and that these differences occurred mainly due to the limitations found in each information source. Some of the divergence resulted from the inaccuracies of each type of data source and the difficulties in linking each source for a comparative base. For the local resident, in many instances it was difficult to give the location and exact dimensions of the elements that made up their properties, although the description of such elements and their general layout would have been very helpful. Furthermore, the resolution of the satellite images and the limitations of the instruments used in the analysis made it difficult to differentiate land cover in areas that were less than 900 m2 (e.g., the area of 1 pixel), which can be enough to omit essential components of land use and organization of properties.
The different ways to define and interpret land use and land cover classes constituted another source of differences in our results: the satellite image showed different types of land cover, from which was inferred corresponding types of land use; however, the local resident already favored a functional classification (use) over the appearance (cover) of the landscape. This type of confusion, which actually expresses different perspectives of the landscape, was found with certain consistency and with several different categories of land use and land cover. Our tests indicate that successive, overlapping comparisons can help to create classes that are less generic and more useful.
In relation to the second question do the results show the sources of information to be incompatible or complimentary? we found that differences between the two data sets should not be construed as a barrier to the integration of the data sources, but as a way to improve analyses of land use and land cover. The usefulness of the instruments lies in the incorporation of the differences in the results. Knowledge from residents reveals certain forms of orientation and representation of space that can be compared with the orientation and representation from a more technical and scientific perspective, thereby providing information that the satellite images do not easily capture. In ideal and extreme situations, the combining of instruments would not be necessary: a series of cloudless satellite images with a resolution capable of capturing land cover in detail, of the property over time would certainly reduce the number of problems in the classification of land covers and land uses. The same reasoning also applies to study design: a large team of researchers, with unlimited time and energy to walk, as necessary, to record the spatial coordinate locations of land cover and to produce accurate drawings of each property would certainly reduce the degree of inherent uncertainty of this type survey instrument. However, these situations are far from being a part of reality; thus, each data source should be used to compensate for the limitations of the other source, as demonstrated here, using all available amount and types of resources available.
5. Conclusion
The methods adopted to capture the knowledge of local residents about land use and land cover and the processing of these data obtained through sketch drawings showed several sources of problems in the classification of satellite imagery and provided evidence for the need to reclassify imagery, in each of the sketches that were analyzed.
]]> The information provided by respondents often differed from that obtained from satellite images, due to the characteristics and limitations of each instrument. However, results from each data source were compatible and complementary, thus resulting in the combined use of each in analyses.The results obtained here should encourage the improvement of the techniques described in this work, either in data collection, or for data processing and analysis. Tools that may be better suited to facilitate the overlapping of the two data sources need to be improved and developed to reduce the confusion between land use land cover in each classification system.
The combination of data sources, by itself, allows for the dialogue between different actors and analytical perspectives. It is, therefore, a means to enrich analyses of interdisciplinary research themes found at the interface between society and the environment. It also suggests that a deeper appreciation is needed of these survey instruments as different means of capturing and representing knowledge; they should not be limited or restricted solely to the field of study of land use and land cover change, but to ought to be applied to the broader study of the perceptions of and relations between humans and nature, between different subjects, and at multiple scales.
References
ALVES, A. Os argonautas do mangue. Campinas-SP: Editora da Unicamp / Imprensa Oficial, 2004.
BOUCEK, B.; Moran, E. F. Inferring the behavior of households from remotely sensed changes in land cover: current methods and future directions. In: GOODCHILD, M. F.; JANELLE, D. G. (Ed.). Spatially Integrated Social Science. New York, NY: Oxford University Press, 2004. p. 23-47.
BRONDIZIO, E. S. Intraregional analysis of land-use change in the Amazon. In: MORAN, E. F.; OSTROM, E. (Ed.). Seeing the Forest and the Trees: Human-Environment Interactions in Forest Ecosystems. Cambridge, MA: The MIT Press, 2005. p. 223-252.
BRONDIZIO, E. S. et al. The colonist footprint: toward a conceptual framework of land use and deforestation trajectories among small farmers in the Amazonian frontier. In: WOOD, C. H.; PORRO, R. (Ed.). Deforestation and Land Use in the Amazon. Gainesville, FL: University Press of Florida, 2002. p. 133-161.
BROWDER, J. O. Reading colonist landscapes: social factors influencing land use decisions by small farmers in the Brazilian Amazon. In: WOOD, C. H.; PORRO, R. (Ed.). Deforestation and Land Use in the Amazon. Gainesville, FL: University Press of Florida, 2002. p. 218-240.
CASTRO, F. et al. The use of remotely sensed data in rapid rural assessment. Field Methods, Thousand Oaks, CA, v. 14, n. 3, p.243-269, August, 2002.
CHOKKALINGAM, U.; DE JONG, W. Secondary forest: a working definition and typology. International Forestry Review, Shropshire, UK , v. 3, n. 1, p. 19-26, 2001.
CONANT, F. P. 1990 and beyond: satellite remote sensing and ecological anthropology. In: MORAN, E. F. (Ed.). The Ecosystem Approach in Anthropology. Ann Arbor, MI: The University of Michigan Press, 1990. p. 323-356.
ENTWISLE, B.; STERN, P. (Eds). Population, Land Use, and Environment. Washington, D. C.: National Academies Pressed, 2005.
EVANS-PRITCHARD, E. E. Os Nuer: Uma Descrição do Modo de Subsistência e Instituições Politicas de Um Povo Nilota. São Paulo, SP: Editora Perspectiva, 1993.
EVANS, T.; MORAN, E. Spatial integration of social and biophysical factors related to landcover change. Population and development review, v. 28, p. 165-186, 2002.
FELDMAN-BIANCO, B.; LEITE, M. L. M. Os desafios da imagem: fotografia, iconografia e vídeo nas Ciências Sociais. Campinas-SP: Papirus, 1998.
GEOGHEGAN, J. et al. Modeling tropical deforestation in the southern Yucatán peninsular region: comparing survey and satellite data. Agroecosystems and Environment, Amsterdan, v. 85, n. 1-3, p. 25-46, 2001.
GIBSON, C.; OSTROM, E.; AHN, T. K. The concept of scale and the human dimensions of global change: a survey. Ecological Economics, Amsterdan, v. 32, n. 2, p. 217-239, 2000.
GUTMAN, G. et al. (Eds.) Land Change Science: Observing, Monitoring, and Understanding Trajectories of Change on the Earth's Surface. Local: Springer, v. 6, p. 461, 2004.
LAMBIN, E. F.; GEIST, H. J.; LEPERS, E. Dynamics of land-use and land-cover change in tropical regions. Annual Review of Environment and Resources, Stanford, CA, v. 28, p. 205-241, 2003.
LI, Y. et al. Discrimination between very advanced secondary succession and moist mature forest near Altamira, Brazil using TM data. The American Society for Photogrammetry and Remote Sensing and Annual Meeting of ASPRS. Reno, NV: ACSM/ASPRS International Proceedings, 1994. p. 350-364.
LIVERMAN, D. et al. People and Pixels: Linking Remote Sensing and Social Science. Washington, D. C.: National Academy Press, 1998.
LU, D. et al. A comparative study of Terra ASTER, Landsat TM, and SPOT HRG data for land cover classification in the Brazilian Amazon. The 9th World Multi-Conference on Systematics, Cybernetics, and Informatics (WMSCI 2005). Orlando, FL: International Institute of Informatics and Systematics, p. 411-416, 2005.
LU, D. S. et al. Comparison of land-cover classification methods in the Brazilian Amazon Basin. Photogrammetric Engineering and Remote Sensing, Bethesda, MD, v. 70, n. 6, p. 723-731, jun. 2004ª.
LU, D. S. et al. Classification of successional forest stages in the Brazilian Amazon basin. Forest Ecology and Management, Amsterdan, v. 181, n. 3, p. 301-312, aug. 2003.
______. Relationships between forest stand parameters and Landsat TM spectral responses in the Brazilian Amazon Basin. Forest Ecology and Management, Amsterdan, v. 198, n. 1-3, p. 149-167, aug. 2004b.
MAUSEL, P. et al. Spectral identification of successional stages following deforestation in the Amazon. Geocarto International, Reino Unido, v. 8, p. 61-71, 1993.
MCCRACKEN, S. D. et al. Remote sensing and GIS at farm property level: Demography and deforestation in the Brazilian Amazon. Photogrammetric Engineering and Remote Sensing, Bethesda, MD, v. 65, n. 11, p. 1311-1320, nov. 1999.
MORAN, E. F. Human Adaptability: An Introduction to Ecological Anthropology. Boulder, CO: Westview Press, 2000.
MORAN, E. F. et al. Integrating Amazonian vegetation, land-use, and satellite data.Bioscience, Washington, DC, v. 44, n. 5, p. 329-338, may 1994.
MORAN, E. F.; BRONDIZIO, E.; VANWEY, L. Population and Environment in Amazonia: Landscape and Household Dynamics. In: ENTWISLE, B.; STERN, P. C. (Ed.). Population, Land Use, and Environment. Washington, D.C: The National Academies Press, 2005a. p. 106-134.
______. "Population and environment in Amazônia: landscape and household dynamics". In: ENTWISLE, B.; STERN, P. (Ed.). Population, Land Use, and Environment. Washington, D. C.: National Academies Press, 2005b. p. 106-134.
MORAN, E. F.; BRONDIZIO, E. S. Land-use change after deforestation in Amazonia. In: LIVERMAN, D. et al. (Ed.). People and Pixels: Linking Remote Sensing and Social Science. Washington, D. C.: National Academy Press, 1998. p. 94-120.
MORAN, E. F.; SIQUEIRA, A.; BRONDIZIO, E. Household demographic structure and its relationship to deforestation in the Amazon basin. In: FOX, J. et al. (Ed.). People and the Environment: Approaches to Linking Household and Community Surveys to Remote Sensing and GIS. Boston, MA: Kluwer Academic Press, 2003.
NIEMEYER, A. M. Indicando caminhos: mapas como suporte na orientação espacial e como instrumento no ensino da antropologia. In: GODOI, E. P.; NIEMEYER, A. M. (Ed.). Além dos Territórios: Para Um Diálogo Entre a Etnologia Indigena, os Estudos Rurais e os Estudos Urbanos. Campinas, SP: Mercado das Letras, 1998.
PICHON, F.; BILSBORROW, R. Land use systems, deforestation, and associated demographic factors in the humid tropics. Farm-level Evidence from Ecuador. New York: Oxford University Press, 1996.
RINDFUSS, R. R.; STERN, P. C. Linking remote sensing and social science: the need and the challenges. In: Liverman, D. et al. (Ed.). People and Pixels: Linking Remote Sensing and Social Science. Washington, D. C.: National Academy Press, 1998. p. 1-27.
SAHLINS, M. O 'pessimismo sentimental' e a experiência etnográfica: porque a cultura não é um 'objeto' em via de extinção. Mana, Rio de Janeiro, v. 3, p. 1-2, 1997.
SOARES-FILHO, B. et al. Simulating the response of land-cover changes to road paving and governance along a major Amazon highway: the Santarém-Cuiabá corridor. Global Change Biology, Urbana, IL, v. 10, p. 745-764, 2004.
TUCKER, J. M.; BRONDIZIO, E. S.; MORAN, E. F. Rates of forest regrowth in eastern Amazonia: A comparison of Altamira and Bragantina regions, Para State, Brazil. Interciencia, Caracas, v. 23, n. 2, p. 64-+, mar./apr. 1998.
TURNER, B. L. I. et al. Deforestation in the southern Yucatán peninsular region: an integrative approach. Forest Ecology and Management, Amsterdan, v. 154, p. 343-370, 2001.
TURNER, B. L. I.; GEOGHEGAN, J.; FOSTER, D. R. (Eds.). Integrated Land-Change Science and Tropical Deforestation in the Southern Yucatán: Final Frontiers. Oxford, UK: Clarendon Press of Oxford University Pressed, 2004.
VANWEY, L. K.; OSTROM, E.; MERETSKY, V. Theories underlying the study of human-environment interactions. In: MORAN, E. F.; OSTROM, E. (Ed.). Seeing the Forest and the Trees: Human-Environment Interactions in Forest Ecosystems. Cambridge, MA: The MIT Press, 2005. p. 23-56.
WALSH, S. J. et al. A multiscale analysis of LULC and NDVI variation in Nang Rong District, Northeast Thailand. Agriculture Ecosystems & Environment, Amsterdan, v. 85, n. 1-3, p. 47-64, 2001.
WOOD, C. H.; PORRO, R. (Eds.). Deforestation and Land Use in the Amazon. Gainesville, FL: University Press of Floridaed, 2002.
 Corresponding Author: ]]>
Álvaro de Oliveira DAntona.
Corresponding Author: ]]>
Álvaro de Oliveira DAntona.
FCA-Unicamp. Rua Pedro Zaccaria, 1300.
Jd. Sta Luiza. Limeira, SP.
CEP 13484-350.
Email: adantona@unicamp.br
* This paper is a revised and expanded version of the article Uso e cobertura da terra na Amazônia: o conhecimento "Técnico-Científico" versus o "Conhecimento Empírico" dos moradores de lotes rurais na rodovia Transamazônica, Pará. Presented at the III Encontro da ANPPAS, in Brasília, May 2006.
]]>