<?xml version="1.0" encoding="ISO-8859-1"?><article xmlns:mml="http://www.w3.org/1998/Math/MathML" xmlns:xlink="http://www.w3.org/1999/xlink" xmlns:xsi="http://www.w3.org/2001/XMLSchema-instance">
<front>
<journal-meta>
<journal-id>0121-4772</journal-id>
<journal-title><![CDATA[Cuadernos de Economía]]></journal-title>
<abbrev-journal-title><![CDATA[Cuad. Econ.]]></abbrev-journal-title>
<issn>0121-4772</issn>
<publisher>
<publisher-name><![CDATA[Universidad Nacional de Colômbia]]></publisher-name>
</publisher>
</journal-meta>
<article-meta>
<article-id>S0121-47722008000100002</article-id>
<title-group>
<article-title xml:lang="en"><![CDATA[Testing happiness hypotheses among the elderly]]></article-title>
<article-title xml:lang="es"><![CDATA[Un test de la hipótesis de la felicidad en la población de la tercera edad]]></article-title>
<article-title xml:lang="fr"><![CDATA[Un test de l'hypothèse du bonheur dans la population du troisième âge]]></article-title>
</title-group>
<contrib-group>
<contrib contrib-type="author">
<name>
<surname><![CDATA[Cid]]></surname>
<given-names><![CDATA[Alejandro]]></given-names>
</name>
<xref ref-type="aff" rid="A01"/>
</contrib>
<contrib contrib-type="author">
<name>
<surname><![CDATA[Ferrés]]></surname>
<given-names><![CDATA[Daniel]]></given-names>
</name>
<xref ref-type="aff" rid="A02"/>
</contrib>
<contrib contrib-type="author">
<name>
<surname><![CDATA[Rossi]]></surname>
<given-names><![CDATA[Máximo]]></given-names>
</name>
<xref ref-type="aff" rid="A03"/>
</contrib>
</contrib-group>
<aff id="A01">
<institution><![CDATA[,Universidad de Montevideo (Uruguay) Departamento de Economía ]]></institution>
<addr-line><![CDATA[ ]]></addr-line>
</aff>
<aff id="A02">
<institution><![CDATA[,Universidad de Montevideo (Uruguay) Departamento de Economía ]]></institution>
<addr-line><![CDATA[ ]]></addr-line>
</aff>
<aff id="A03">
<institution><![CDATA[,Universidad de Montevideo (Uruguay) Facultad de Ciencias Sociales Departamento de Economía]]></institution>
<addr-line><![CDATA[ ]]></addr-line>
</aff>
<pub-date pub-type="pub">
<day>00</day>
<month>00</month>
<year>2008</year>
</pub-date>
<pub-date pub-type="epub">
<day>00</day>
<month>00</month>
<year>2008</year>
</pub-date>
<volume>1</volume>
<numero>se</numero>
<fpage>0</fpage>
<lpage>0</lpage>
<copyright-statement/>
<copyright-year/>
<self-uri xlink:href="http://socialsciences.scielo.org/scielo.php?script=sci_arttext&amp;pid=S0121-47722008000100002&amp;lng=en&amp;nrm=iso"></self-uri><self-uri xlink:href="http://socialsciences.scielo.org/scielo.php?script=sci_abstract&amp;pid=S0121-47722008000100002&amp;lng=en&amp;nrm=iso"></self-uri><self-uri xlink:href="http://socialsciences.scielo.org/scielo.php?script=sci_pdf&amp;pid=S0121-47722008000100002&amp;lng=en&amp;nrm=iso"></self-uri><abstract abstract-type="short" xml:lang="en"><p><![CDATA[We use a rich data set that allows us to test different happiness hypotheses employing four methodological approaches. We find that older people in Uruguay have a tendency to report themselves happy when they are married, when they have higher standards of health and when they earn higher levels of income or they consider that their income is suitable for their standard of living. On the contrary, they report lower levels of happiness when they live alone and when their nutrition is insufficient. We also find that education has no clear impact on happiness. We think that our study is a contribution to the study of those factors that can explain happiness among the elderly in Latin American countries. Future work will focus on enhanced empirical analysis and in extending our study to other countries.]]></p></abstract>
<abstract abstract-type="short" xml:lang="es"><p><![CDATA[Se emplea un amplio conjunto de datos que permite evaluar de diferentes formas la hipótesis de la felicidad, empleando cuatro enfoques metodológicos. Se constata que las personas de mayor edad en Uruguay tienen una tendencia a reconocerse felices cuando están casadas, cuando tienen un buen estado de salud y si tienen altos ingresos monetarios o estiman que su ingreso es conveniente para su nivel de vida. Contrariamente, señalan niveles más bajos de felicidad cuando viven solos o cuando su nutrición es insuficiente. Se evidencia que la educación no tiene un impacto claro sobre su percepción de felicidad. Este trabajo es una contribución al estudio de los factores que pueden explicar la felicidad entre las personas de la tercera edad en los países de América Latina. El trabajo futuro se concentrará sobre un análisis empírico mejorado y sobre la expansión del estudio a otros países.]]></p></abstract>
<abstract abstract-type="short" xml:lang="fr"><p><![CDATA[On utilise un ensemble de données très large qui permet d'évaluer des formes différentes d'hypothèse de bonheur sous quatre approches méthodologiques différentes. On constate que les personnes les plus âgées en Uruguay ont une tendance de se reconnaitre heureux quand ils sont mariés, quand ils ont de niveaux de santé plus élèves et quand ils ont plus de revenus monétaires ou ils estiment que leur revenu est convenable pour leur niveau de vie. Au contraire, ils signalent des niveaux plus bas de bonheur quand ils vivent seuls et quand leur nutrition est insuffisante. Nous constatons aussi que l'éducation n'a aucun impact clair sur leur perception du bonheur. Ce travail est une contribution à l'étude des facteurs qui peuvent expliquer le bonheur parmis les personnes âgées dans les pays de l'Amérique Latine. Le travail futur se concentrera sur une analyse empirique améliorée et sur l'extension de l'étude à d'autres pays.]]></p></abstract>
<kwd-group>
<kwd lng="en"><![CDATA[Happiness]]></kwd>
<kwd lng="en"><![CDATA[Health]]></kwd>
<kwd lng="en"><![CDATA[Family]]></kwd>
<kwd lng="en"><![CDATA[Censored Econometric Models]]></kwd>
<kwd lng="en"><![CDATA[Semiparametric Methods]]></kwd>
<kwd lng="en"><![CDATA[Treatment Evaluation]]></kwd>
<kwd lng="es"><![CDATA[felicidad]]></kwd>
<kwd lng="es"><![CDATA[salud]]></kwd>
<kwd lng="es"><![CDATA[familia]]></kwd>
<kwd lng="es"><![CDATA[modelos econométricos censurados]]></kwd>
<kwd lng="es"><![CDATA[métodos semi-paramétricos]]></kwd>
<kwd lng="es"><![CDATA[evaluación de tratamiento]]></kwd>
<kwd lng="fr"><![CDATA[bonheur]]></kwd>
<kwd lng="fr"><![CDATA[santé]]></kwd>
<kwd lng="fr"><![CDATA[famille]]></kwd>
<kwd lng="fr"><![CDATA[modèles économétriques censurés]]></kwd>
<kwd lng="fr"><![CDATA[méthodes semi-paramétriques]]></kwd>
<kwd lng="fr"><![CDATA[évaluation de traitement]]></kwd>
</kwd-group>
</article-meta>
</front><body><![CDATA[ <p><font face="Verdana, Arial, Helvetica, sans-serif" size="4"><b><a name="top"></a>Testing    happiness hypotheses among the elderly</b></font></p>     <p>&nbsp;</p>     <p><font face="Verdana, Arial, Helvetica, sans-serif" size="3"><b>Un test de la    hipótesis de la felicidad en la población de la tercera edad</b></font></p>     <p>&nbsp;</p>     <p><font face="Verdana, Arial, Helvetica, sans-serif" size="3"><b>Un test de l'hypothèse    du bonheur dans la population du troisième âge</b></font></p>     <p>&nbsp;</p>     <p>&nbsp;</p>     <p><font face="Verdana, Arial, Helvetica, sans-serif" size="2"><b>Alejandro Cid<sup>I,<sup>*</sup></sup>;    Daniel Ferrés<sup>II</sup>; Máximo Rossi<sup>III</sup></b></font></p>     <p><font face="Verdana, Arial, Helvetica, sans-serif" size="2"><sup>I</sup>Alejandro    Cid es Magíster en Economía y profesor del Departamento de Economía de la Universidad    de Montevideo (Uruguay). E-mail: <a href="mailto:acid@um.edu.uy">acid@um.edu.uy</a>    <br>   <sup>II</sup>Daniel Ferrés es Magíster en Economía y profesor asistente del    Departamento de Economía de la Universidad de Montevideo (Uruguay). E-mail:    <a href="mailto:dferres@um.edu.uy">dferres@um.edu.uy</a>    ]]></body>
<body><![CDATA[<br>   <sup>III</sup>Máximo Rossi es candidato a Doctor en Economía, profesor titular    (grado 5) del Departamento de Economía, Facultad de Ciencias Sociales de la    Universidad de la República (Montevideo, Uruguay). E-mail: <a href="mailto:mito@decon.edu.uy">mito@decon.edu.uy</a></font></p>     <p><font face="Verdana, Arial, Helvetica, sans-serif" size="2">Replicated from    <b>Cuadernos de Econom&iacute;a</b>, Bogot&aacute;, v.27, n.48, p. 23-45, Jan/June.    2008.</font></p>     <p>&nbsp;</p>     <p>&nbsp;</p> <hr size="1" noshade>     <p><font face="Verdana, Arial, Helvetica, sans-serif" size="2"><b>ABSTRACT</b></font></p>     <p><font face="Verdana, Arial, Helvetica, sans-serif" size="2">We use a rich data    set that allows us to test different happiness hypotheses employing four methodological    approaches. We find that older people in Uruguay have a tendency to report themselves    happy when they are married, when they have higher standards of health and when    they earn higher levels of income or they consider that their income is suitable    for their standard of living. On the contrary, they report lower levels of happiness    when they live alone and when their nutrition is insufficient. We also find    that education has no clear impact on happiness. We think that our study is    a contribution to the study of those factors that can explain happiness among    the elderly in Latin American countries. Future work will focus on enhanced    empirical analysis and in extending our study to other countries.</font></p>     <p><font face="Verdana, Arial, Helvetica, sans-serif" size="2"><b>Keywords: </b>Happiness,    Health, Family, Censored Econometric Models, Semiparametric Methods, Treatment    Evaluation. <b>JEL: </b>C14, C24, I10, J12.</font></p> <hr size="1" noshade>     <p><font face="Verdana, Arial, Helvetica, sans-serif" size="2"><b>RESUMEN</b></font></p>     <p><font face="Verdana, Arial, Helvetica, sans-serif" size="2">Se emplea un amplio    conjunto de datos que permite evaluar de diferentes formas la hipótesis de la    felicidad, empleando cuatro enfoques metodológicos. Se constata que las personas    de mayor edad en Uruguay tienen una tendencia a reconocerse felices cuando están    casadas, cuando tienen un buen estado de salud y si tienen altos ingresos monetarios    o estiman que su ingreso es conveniente para su nivel de vida. Contrariamente,    señalan niveles más bajos de felicidad cuando viven solos o cuando su nutrición    es insuficiente. Se evidencia que la educación no tiene un impacto claro sobre    su percepción de felicidad. Este trabajo es una contribución al estudio de los    factores que pueden explicar la felicidad entre las personas de la tercera edad    en los países de América Latina. El trabajo futuro se concentrará sobre un análisis    empírico mejorado y sobre la expansión del estudio a otros países.</font></p>     <p><font face="Verdana, Arial, Helvetica, sans-serif" size="2"><b>Palabras clave:    </b>felicidad, salud, familia, modelos econométricos censurados, métodos semi-paramétricos,    evaluación de tratamiento. <b>JEL: </b>C14, C24, I10, J12.</font></p> <hr size="1" noshade>     ]]></body>
<body><![CDATA[<p><font face="Verdana, Arial, Helvetica, sans-serif" size="2"><b>RESUM&Eacute;</b></font></p>     <p><font face="Verdana, Arial, Helvetica, sans-serif" size="2">On utilise un ensemble    de données très large qui permet d'évaluer des formes différentes d'hypothèse    de bonheur sous quatre approches méthodologiques différentes. On constate que    les personnes les plus âgées en Uruguay ont une tendance de se reconnaitre heureux    quand ils sont mariés, quand ils ont de niveaux de santé plus élèves et quand    ils ont plus de revenus monétaires ou ils estiment que leur revenu est convenable    pour leur niveau de vie. Au contraire, ils signalent des niveaux plus bas de    bonheur quand ils vivent seuls et quand leur nutrition est insuffisante. Nous    constatons aussi que l'éducation n'a aucun impact clair sur leur perception    du bonheur. Ce travail est une contribution à l'étude des facteurs qui peuvent    expliquer le bonheur parmis les personnes âgées dans les pays de l'Amérique    Latine. Le travail futur se concentrera sur une analyse empirique améliorée    et sur l'extension de l'étude à d'autres pays. </font></p>     <p><font face="Verdana, Arial, Helvetica, sans-serif" size="2"><b>Mot clés : </b>bonheur,    santé, famille, modèles économétriques censurés, méthodes semi-paramétriques,    évaluation de traitement. <b>JEL : </b>C14, C24, I10, J12.</font></p> <hr size="1" noshade>     <p>&nbsp;</p>     <p>&nbsp;</p>     <p><font face="Verdana, Arial, Helvetica, sans-serif" size="2">Fresh interest    among economists in using surveys of reported well being as a way to measure    individual utility and its relation to a range of economic and social phenomena    provides a new tool to understand what causes happiness.</font></p>     <p><font face="Verdana, Arial, Helvetica, sans-serif" size="2">Happiness indicators    have been defined in different ways in the economics literature (see Layard,    2005 or Argyle, 2002 for a reflective summary). A large body of research on    happiness in economics takes reported subjective well-being as a proxy measure    for utility. Various studies are based on surveys that contain the following    question: "How satisfied are you with your life?" In our work we follow    this approach and we define "happiness" as satisfaction with life    in general. Based on the analysis of survey data on subjective wellbeing, our    work is guided by the question: "how does x affect happiness?", where    x can be income, health, marital status or employment status.</font></p>     <p><font face="Verdana, Arial, Helvetica, sans-serif" size="2">It is hard to make    comparisons of happiness levels accross countries. As Diener and Suh (2000)    state, although researchers can empirically study quality of life and make comparisons    of the subjective well-being of societies, it is unclear if we will be ever    able to conclude in a definitive way that one society is better than another    in terms of overall quality of life. In the end, happiness and other indicators    of quality of life depend on idiosyncratic values and judgements. Still, survey    data allows us to make comparisons and draw conclusions about which societies    have greater subjective well-being.</font></p>     <p><font face="Verdana, Arial, Helvetica, sans-serif" size="2">Different relationships    between happiness and specific variables have been explored in recent economic    work. In particular, various scholars have devoted a good amount of effort trying    to assess the relationship between income and happiness. This issue is particularly    attractive to many people for one reason: there is vast evidence indicating    that differences in income explain only a low proportion of the differences    in happiness among persons. Moreover, although many countries have experienced    strong increases in their per capita GDP, it is not generally true that these    countries have seen average happiness rise (Blanchflower and Oswald 2004, Layard    1980). This observation is particularly true for the cases of the US, the UK,    Japan and Belgium.</font></p>     <p><font face="Verdana, Arial, Helvetica, sans-serif" size="2">Along these lines,    Oswald (1997) finds that happiness with life appears to be increasing in the    United States throughout the 1970s, 1980s and 1990s. However the rise is so    small that it seems extra income is not contributing dramatically to the quality    of people's lives. Also he finds that since the early 1970s reported levels    of satisfaction with life in the European countries have on average risen very    slightly. In addition, Argyle (2002) provides a good summary of the "income    and happiness" relationships and he obtains contradictory results. For    example, he observes that rising incomes have not affected life satisfaction    and that winning lotteries has negative effects for some. Also, he finds that    often the rich are not happier than those with middle income. On the other hand,    Argyle observes that the very poor are less happy, and richer countries have    higher levels of reported happiness than poorer countries. Scholars, puzzled    by these surprising observations, have worked on coming up with new hypotheses    to try to explain subjective well-being. In particular, recent work has focused    on testing the relevance of inequality, relative income and income aspirations    when trying to understand what causes happiness.</font></p>     ]]></body>
<body><![CDATA[<p><font face="Verdana, Arial, Helvetica, sans-serif" size="2">Alesina <i>et al</i>.    (2003) studied the effect of income inequality in society on individual well-being.    In their work, they found that "individuals have a lower tendency to report    themselves happy when inequality is high, even after controlling for individual    income". They compared results obtained for European countries and the    United States.<a name=nr1></a><sup><a href="#1">1</a></sup> Interestingly, their results are clearly different across    socioeconomic groups in Europe and the US. In particular, they found that in    Europe the poor and those on the left of the political spectrum become unhappy    as inequality grows. On the other hand, in the US, the happiness of the poor    and of those on the left is uncorrelated with inequality.</font></p>     <p><font face="Verdana, Arial, Helvetica, sans-serif" size="2">Frey and Stutzer    (2003) tested different happiness hypotheses. In particular, they conducted    an empirical test of the role of income aspirations. Their idea is based on    the observation that many people compare themselves to those that are considered    their others. In the past, many economists have explored this idea when trying    to understand different socioeconomic phenomena.</font></p>     <p><font face="Verdana, Arial, Helvetica, sans-serif" size="2">Frey and Stutzer    concluded that "the evidence presented indicates that people's well-being    is better understood when their income aspirations are taken into consideration".    Layard (1980) observed that happiness depends on income and status relative    to what you expected it to be. An obvious problem with high income is that you    get used to it. Richer people take high income for granted and cannot do without    it. The same is true for status. Layard also stated that this could explain    why people fight much harder against cuts in their income than for increases    in their earnings.</font></p>     <p><font face="Verdana, Arial, Helvetica, sans-serif" size="2">Clark and Oswald    (1994) analyzed the impact of unemployment on happiness using data from the    British Household Panel Study (1991). In their work, they constructed a "caseness    score" using 12 questions present in the survey. After controlling for    specific individual characteristics, they utilized ordered probit estimation    in order to explore the relationship between unemployment and mental well-being.    They concluded that there is a strong negative relationship between these variables.    Moreover, they observed that the effect of unemployment on well-being can be    stronger "than any other single characteristic, including important negative    ones such as divorce and separation".</font></p>     <p><font face="Verdana, Arial, Helvetica, sans-serif" size="2">Other economists    have examined the relationship between happiness and different individual variables.    Stack and Eshleman (1998) analyzed the relationship between marriage and happiness    in a multi-country study. In particular, they observed that the positive relationship    between being married and happiness indicators held for 16 of the 17 cases analyzed.</font></p>     <p><font face="Verdana, Arial, Helvetica, sans-serif" size="2">Health status is    another factor that can be expected to be an especially important determinant    of happiness. Gerdtham and Johannesson (1997) analyzed the relationship between    happiness and health status based on data on a sample of 5,000 individuals in    the Swedish adult population. In their study, they found a positive and statistically    significant relationship between higher health status and happiness.</font></p>     <p><font face="Verdana, Arial, Helvetica, sans-serif" size="2">Various studies    focus on the relationship between aging and happiness. Oswald (1997) and Cruz    and Torres (2006) found that the relationship between happiness and age is U-shaped.    While Oswald found that happiness indicators in Europe reach the minimum levels    at age around 30, Cruz and Torres find that for the case of Colombia, the happiness    curve decreases as it approaches to age 40; then it becomes a growing function.    In our research we have focused on a sample of individuals of age 60 or more.    As we will indicate in the results section, we get no robust "age" effect in    our investigation.</font></p>     <p>&nbsp;</p>     <p align="center"><img src="/img/revistas/s_ceco/v1nse/a02grap1.jpg"></p>     <p>&nbsp;</p>     ]]></body>
<body><![CDATA[<p><font face="Verdana, Arial, Helvetica, sans-serif" size="2">So far, most of    the research on the relationship between individual characteristics and happiness    has focused on industrialized countries. It is evident that factors affecting    satisfaction with life may vary from region to region. The impact of income    or family composition on happiness can be very much related to cultural issues.    Recent studies have focused on happiness analysis in Latin America. Interestingly,    Graham and Felton (2005) analyzed the effect of income inequality on happiness    across Latin American countries. Their work is based on data gathered in Latinobarometro.    Also, Gerstenbluth <i>et al</i>. (2007) studied the relationship between happiness    and health in Argentina and Uruguay using the Latinobarometro survey. Bucheli    (2003) focused on analyzing happiness issues among Uruguayan women in the age    range between 25 and 54 and Cruz (2006) tested various happiness hypotheses    among Colombians.</font></p>     <p><font face="Verdana, Arial, Helvetica, sans-serif" size="2">Our work represents    a fresh attempt to understand the factors that may be related to a higher satisfaction    with life in Uruguay, a Latin American country. In particular we will explore    the correlation between happiness and income, family structure and health.</font></p>     <p><font face="Verdana, Arial, Helvetica, sans-serif" size="2">Correlations do    not establish causation. In this sense, we understand that a crucial aspect    of our future work will be related to trying to understand the way in which    causality goes. A happiness function assumes that the right hand variables determine    the level of the dependent variable. In the case of our study, we are aware    that there may also be a reverse causation. For example, are happy people more    likely to be married or is it that marriage causes happiness? In order to explore    and deal with this selection bias we employ the propensity score technique.</font></p>     <p><font face="Verdana, Arial, Helvetica, sans-serif" size="2">The rest of the    paper continues as follows. In section 2 we describe the data set and different    happiness indicators. In section 3 we deal with multiple methodological aspects    of our work. In section 4 we present the obtained results. In section 5 we present    the p-score results. In section 6 we conclude.</font></p>     <p>&nbsp;</p>     <p><font face="Verdana, Arial, Helvetica, sans-serif" size="3"><b>DATA AND HAPPINESS    INDICATORS</b></font></p>     <p><font face="Verdana, Arial, Helvetica, sans-serif" size="2"><b>Data</b></font></p>     <p><font face="Verdana, Arial, Helvetica, sans-serif" size="2">
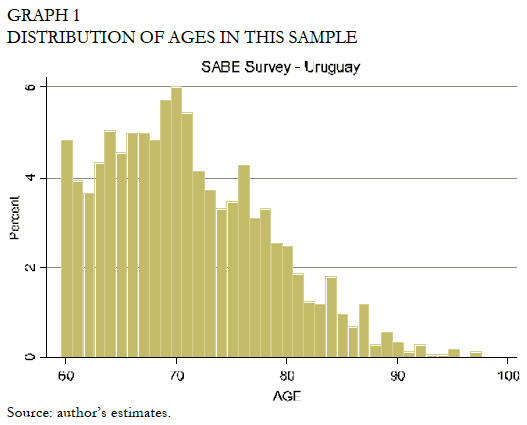
Our analysis of    the determinants of happiness in Uruguay relies on data from a multicountry    survey called Salud, Bienestar y Envejecimiento en Am&eacute;rica Latina y el    Caribe (SABE), a study sponsored by the Pan American Health Organization (PAHO)<a name=nr2></a><sup><a href="#2">2</a></sup>.    Since the survey is limited to the single largest city in each country, we focus    on information for Montevideo (1,444 observations). SABE data was collected    in 1999-2000.</font></p>     <p><font face="Verdana, Arial, Helvetica, sans-serif" size="2">Since the survey    gathers information about the elderly, the sampling frame limits its scope to    those 60 and older. Individuals living in institutions, such as nursing homes    and mental institutions are excluded from the sample. <a href="#t1">Table 1</a>    presents descriptive statistics of both dependent and independent variables.</font></p>     <p><a name="t1"></a></p>     ]]></body>
<body><![CDATA[<p>&nbsp;</p>     <p align="center"><img src="/img/revistas/s_ceco/v1nse/a02tab01.gif"></p>     <p>&nbsp;</p>     <p><font face="Verdana, Arial, Helvetica, sans-serif" size="2">Independent variables    include indications of age, gender, family structure, education, health status,    employment status and income. Information on these variables is present on SABE,    except for income.<a name=nr5></a><sup><a href="#5">5</a></sup> The income variable is a constructed variable, obtained    after extrapolating data from the Encuesta Continua de Hogares. Our approach    leads to a new indicator for individual income level (see <a href="#app"><b>Appendix    A</b></a> for details) and is different from the analysis of Graham and Felton    (2005) who constructed an "asset index" based on household possessions.</font></p>     <p><font face="Verdana, Arial, Helvetica, sans-serif" size="2"><a href="#t2">Table    2</a> presents mean values for the independent variable among the happy and    the unhappy.</font></p>     <p><a name="t2"></a></p>     <p>&nbsp;</p>     <p align="center"><img src="/img/revistas/s_ceco/v1nse/a02tab02.gif"></p>     <p>&nbsp;</p>     <p><font face="Verdana, Arial, Helvetica, sans-serif" size="2"><b>Happiness Indicators</b></font></p>     ]]></body>
<body><![CDATA[<p><font face="Verdana, Arial, Helvetica, sans-serif" size="2">Our objective is    to test how individual's judgment of well-being is affected by a group of individual    characteristics and socioeconomic variables. We follow two paths when defining    the dependent variable. Constructing two types of "happiness" indicators    will allow us to conduct more robust econometric analysis about the impact of    specific variables on happiness. We believe that this issue constitutes a strong    aspect of our estimation approach.</font></p>     <p><font face="Verdana, Arial, Helvetica, sans-serif" size="2">First, we construct    a dummy variable indicating "satisfaction with life". This variable    is constructed based on the following question: "In the last two weeks:    have you been satisfied with your life?" Respondents can answer "yes"    or "no". We use this binary variable in a probit estimation. Also    we build an index of happiness based on 15 binary responses to questions related    to life satisfaction (for each question, a 0 is assigned to "No" and    1 to "Yes"). Thus, this index takes the integer values from 0 to 15,    where superior values mean greater life satisfaction. We used this definition    of happiness when conducting OLS analysis. Finally, we expressed this index    in percentage terms in order to use it in the semiparametric model.</font></p>     <p><font face="Verdana, Arial, Helvetica, sans-serif" size="2"><a href="#t3">Table    3</a> presents descriptive statistics about the constructed happiness indicators.</font></p>     <p><a name="t3"></a></p>     <p>&nbsp;</p>     <p align="center"><img src="/img/revistas/s_ceco/v1nse/a02tab03.gif"></p>     <p>&nbsp;</p>     <p><font face="Verdana, Arial, Helvetica, sans-serif" size="2"><b>Income and Happiness</b></font></p>     <p><font face="Verdana, Arial, Helvetica, sans-serif" size="2">As we said, the    relationship between income and happiness can be analyzed from several different    points of views. Economists have focused on issues such as the relationship    between (a) absolute income and happiness; (b) relative income and happiness;    (c) income inequality and happiness; (d) income aspirations and happiness.<a name=nr8></a><sup><a href="#8">8</a></sup>    There is sufficient evidence that absolute income, alone, does not play a substantial    role in explaining happiness levels. In our work we will consider income as    an independent variable, but also relative income and income aspirations.</font></p>     <p><font face="Verdana, Arial, Helvetica, sans-serif" size="2">Broadly speaking,    relative income is defined as the difference between individual income and the    average income for the reference group. In our work we take the following approach:    we include a variable indicating the income percentile to which the respondent    belongs.<a name=nr9></a><sup><a href="#9">9</a></sup> Income aspirations information is collected from the following    question: "Do you think that you (and your partner) have enough money in    order to cover your daily expenses?"</font></p>     ]]></body>
<body><![CDATA[<p><font face="Verdana, Arial, Helvetica, sans-serif" size="2"><b>Family and Happiness</b></font></p>     <p><font face="Verdana, Arial, Helvetica, sans-serif" size="2">In a context of    rapid transformation of typical family structures we attempt to understand the    effects of changes in family composition on happiness. In this sense, since    our data set focuses on the elderly, it provides a unique opportunity to assess    the long term impact of divorce and remarriage on individual happiness.</font></p>     <p><font face="Verdana, Arial, Helvetica, sans-serif" size="2">There is vast evidence    about the negative impact of divorce on life satisfaction. Again, most of this    evidence is reflected by data related to industrialized countries. Our datas<i>et    al</i>lows us to investigate the impact of marriage and divorce in the Latin    American region. We know that our dataset restricts our attention to those that    were 60 or older in 1999-2000. In issues related to moral related values, it    is definitely interesting to compare our results to other studies that may contain    information for younger cohorts.</font></p>     <p><font face="Verdana, Arial, Helvetica, sans-serif" size="2"><b>Health status    and Happiness</b></font></p>     <p><font face="Verdana, Arial, Helvetica, sans-serif" size="2">In our work we    analyze the impact of health in both absolute and relative terms. In particular    we constructed two different variables: one that indicates the self reported    health condition and another that expresses respondents' opinions about individual    health compared to other people in their age group. The intuition for taking    both variables into account is that working with both absolute and relative    terms will enhance our understanding of happiness levels.</font></p>     <p>&nbsp;</p>     <p><font face="Verdana, Arial, Helvetica, sans-serif" size="3"><b>ESTIMATION</b></font></p>     <p><font face="Verdana, Arial, Helvetica, sans-serif" size="2">We follow four    different strategies because we understand that by proceeding in this way we    add robustness to our analysis. We believe that each of the techniques that    we use presents a potential advantage:</font></p>     <p><font face="Verdana, Arial, Helvetica, sans-serif" size="2"><b>Ordinary Least    Squares Estimation</b><a name=nr10></a><b><sup><a href="#10">10</a></sup></b></font></p>     <p><font face="Verdana, Arial, Helvetica, sans-serif" size="2">We run an OLS regression    where a "happiness index" is the dependent variable. This particular    model estimation presents a major advantage: it is very intuitive and it has    a straightforward interpretation. On the downside, we are aware that the index    is built based on answers to 15 questions (point values range from 0 to 15,    where superior values indicate greater life satisfaction). Defined in this way,    "Happiness" could be seen as a doubly censored variable which takes    on the value zero and fifteen with positive probability. In other words, the    dependent variable suffers from interval censoring and OLS could provide inconsistent    estimators. Other shortcomings of the linear probability model are: a) predicted    values for "Happiness" could be negative or greater than fifteen;    b) the variance of "Happiness" is probably heteroskedastic; c) E(Happiness|x)    is nonlinear.</font></p>     ]]></body>
<body><![CDATA[<p><font face="Verdana, Arial, Helvetica, sans-serif" size="2"><b>Probit</b></font></p>     <p><font face="Verdana, Arial, Helvetica, sans-serif" size="2">In our study, we    define a dummy variable that takes the value of 1 when individuals express satisfaction    with life. Both logit and probit models are suitable to analyze the link between    independent variables and the "satisfaction with life" variable. Probit    may be a more appropriate choice for the case in which normal distribution of    the dependent variable can be assumed.</font></p>     <p><font face="Verdana, Arial, Helvetica, sans-serif" size="2"><b>Tobit</b></font></p>     <p><font face="Verdana, Arial, Helvetica, sans-serif" size="2">Because the dependent    variable suffers from interval censoring, we also applied a Tobit Model. We    take into account that heteroskedasticity and nonnormality result in the Tobit    estimator being inconsistent.</font></p>     <p><font face="Verdana, Arial, Helvetica, sans-serif" size="2"><b>A Semiparametric    Censored Regression Model</b></font></p>     <p><font face="Verdana, Arial, Helvetica, sans-serif" size="2">As mentioned above,    Tobit models require some specifications of the error distribution: normality    and homoskedasticity. In order to relax these requirements, the semiparametric    approach has been proposed in the recent economic literature to provide consistent    estimates for censored data. Thus one of the advantages of semiparametric models    for censored models is that estimators are consistent under weaker distributional    assumptions. The attribute "semiparametric" in this model comes from    the fact that the distribution of the errors given the explanatory variables    does not have a known parametric form. In this work we present results for the    symmetrically censored least squares (SCLS) estimator.</font></p>     <p><font face="Verdana, Arial, Helvetica, sans-serif" size="2">The symmetrically    censored least squares (SCLS) approach was proposed by Powell (1986). This estimator    is based on the assumption that errors are symmetrically (and independently)    distributed around zero, so it is less restrictive than Tobit requirements (normally    distributed and homoskedastic errors). The SCLS estimators are consistent and    asymptotically normal for a wide class of symmetric error distributions with    heteroskedasticity of unknown form (for a summary, see Chay and Powell, 2001,    or Cameron and Trivedi, 2005).</font></p>     <p><font face="Verdana, Arial, Helvetica, sans-serif" size="2">Powell (1986) states    that if the underlying error terms were symmetrically distributed about zero,    and if the latent dependent variables were observable, classical least squares    estimation would yield consistent estimates. But due to the censoring, the observed    dependent variable y has an asymmetric distribution. Powell's approach consists    in symmetrically censoring the dependent variable y (it is usually known as    a "symmetric trimmed" method) so that symmetry can be restored, and    then the regression coefficients can be estimated by least squares. Symmetric    censoring of the dependent variable implies that observations with values above    the censoring point are dropped, and this means that there could be a loss of    efficiency due to the information dropped in those observations. However this    problem is reduced in the present paper because a relatively large sample is    used.</font></p>     <p>&nbsp;</p>     <p><font face="Verdana, Arial, Helvetica, sans-serif" size="3"><b>RESULTS</b></font></p>     ]]></body>
<body><![CDATA[<p><font face="Verdana, Arial, Helvetica, sans-serif" size="2"><a href="#t4">Table    4</a> presents results for the four model estimations. We present results for    men and women separately.</font></p>     <p><a name="t4"></a></p>     <p>&nbsp;</p>     <p align="center"><img src="/img/revistas/s_ceco/v1nse/a02tab04.gif"></p>     <p>&nbsp;</p>     <p><font face="Verdana, Arial, Helvetica, sans-serif" size="2">Obtained results    indicate that:</font></p> <ul type=disc>       <li><font face="Verdana, Arial, Helvetica, sans-serif" size="2">Being married      has a statistically significant positive effect on happiness among men and      women<a      name=nr11></a><sup><a href="#11">11</a></sup> . This result is consistent      with Stack and Eshleman (1998), who found that in "16 out of 17 analyses      of the individual nations, marital status was significantly related to happiness.      Further, the strength of the association between being married and being happy      is remarkably consistent across nations". Also, Argyle (2002) finds that      social relationships like romantic love, marriage and friendship positively      impact various well-being indicators (happiness, mental and physical health).      Similarly, Oswald (1997) observes that happiness is high among those who are      married in the US and UK.</font></li>       <li><font face="Verdana, Arial, Helvetica, sans-serif" size="2">Living alone      is associated with men showing lower levels of happiness. Similar results      were found by Argyle (2002), who observed that there is a close link between      sociability and happiness.</font></li>       <li><font face="Verdana, Arial, Helvetica, sans-serif" size="2">Income appears      to be a significant explicative variable in our study. This result is similar      to the findings of Cruz and Torres (2006) for the case of Colombia. In the      case of Uruguay, absolute and relative income levels are more heavily related      to higher satisfaction with life among females than among males. In fact,      we barely found any statistically significant relationship between income      levels and happiness among men.</font></li>       <li><font face="Verdana, Arial, Helvetica, sans-serif" size="2">Having bad health      has a statistically significant negative effect on happiness among men and      women. The relationship holds when individuals answer about their own health      status and when they compare themselves to their "reference group".      This result is robust to the four specifications. In this sense, it is possible      to conclude that bad health is clearly related to low levels of satisfaction      with life. Focusing on developing countries, this result is consistent with      Gerstenbluth <i>et al</i>. (2007), who also studied the case of Uruguay (and      Argentina), and with Cruz and Torres (2006) who analyzed satisfaction with      life in Colombia.</font></li>       ]]></body>
<body><![CDATA[<li><font face="Verdana, Arial, Helvetica, sans-serif" size="2">Malnutrition      ("Only one meal a day") is negatively related to happiness indicators      in the case of women. The relationship is weaker for the case of men. Additionally,      results indicate that malnutrition in the early stages of life may have long      term negative effects over happiness indicators.</font></li>       <li><font face="Verdana, Arial, Helvetica, sans-serif" size="2">The relationship      found between education variables and happiness is ambiguous. Nothing can      be concluded in the present investigation about the impact of higher education      over happiness levels. While our results are similar to those obtained by      Graham <i>et al</i> (2005) for various Latin American countries, they differ      from those obtained by Bucheli and Rossi (2003) for the specific analysis      of the Uruguayan case. In that work they analyzed the relationship between      university education and happiness in Uruguay. The authors found that access      to terciary level education explains higher happiness levels among the Uruguayan      women between 25 and 54 years of age. Also, Cruz and Torres (2006) observed      a positive relationship between higher education levels and happiness for      the case of Colombia, Care is required when interpreting our obtained result      since our sample restricts attention to those 60 or older. The obtained result      might imply that education level is not relevant when explaining happiness      levels of the elderly. Our results are similar to those obtained by Graham      <i>et al</i>.</font></li>       <li><font face="Verdana, Arial, Helvetica, sans-serif" size="2">We consider      that we cannot make profound judgements about the relationship between labor      market status and happiness levels. The relationship between unemployment      status and lower levels of happiness is generally confirmed. In our case,      due to the specific characteristics of our sample, we could not check for      this particular relationship. Instead, as we bear in mind that 60 percent      of the sample are retired individuals, we tested whether there is a clear      impact of retiring on happiness. We found no robust results.</font></li>     </ul>     <p><font face="Verdana, Arial, Helvetica, sans-serif" size="2">In sum, we find    that our results are pretty much in line with those obtained by other studies    but in this case for a non-industrialized country. Individuals who have higher    health levels, are or feel richer and are married show higher levels of satisfaction    with life. We also find some evidence showing that malnutrition and living alone    is negatively related to happiness.</font></p>     <p>&nbsp;</p>     <p><font face="Verdana, Arial, Helvetica, sans-serif" size="3"><b>TREATMENT EVALUATION    AND MARITAL STATUS</b></font></p>     <p><font face="Verdana, Arial, Helvetica, sans-serif" size="2">The typical dilemma    in treatment evaluation involves the inference of a causal association between    the treatment and the outcome. In this paper, we pay particular attention to    the effects of personal marital status on happiness. Thus, we observe (y<sub>i</sub>,x<sub>i</sub>,D<sub>i</sub>),    i=1,/img/revistas/s_ceco/v1nse/.,N, where y<sub>i</sub> is the happiness index, x<sub>i</sub> represents    the regressors, and D<sub>i</sub> is the treatment variable and takes the value    1 if the treatment is applied (got married) and is 0 otherwise. The impact of    a hypothetical change in D on y, holding x constant, is of interest. But no    individual is simultaneously observed in both states. Moreover, the sample does    not come from a randomized social experiment: it comes from observational data    and the assignment of individuals to the treatment and control groups is not    random. Hence, we estimate the treatment effects based on propensity score.    This approach is a way to reduce the bias by performing comparisons of outcomes    using treated and control individuals who are as similar as possible (Becker    and Ichino 2002). The propensity score is defined as the conditional probability    of receiving a treatment given pre-treatment characteristics:</font></p>     <p>&nbsp;</p>     <blockquote>       ]]></body>
<body><![CDATA[<p>p(X)=Pr{D=1|X}=E{D|X}</p> </blockquote>     <p>&nbsp;</p>     <p><font face="Verdana, Arial, Helvetica, sans-serif" size="2">where D={0,1} is    the indicator of exposure to treatment and X is the vector of pre-treatment    characteristics.</font></p>     <p><font face="Verdana, Arial, Helvetica, sans-serif" size="2">The propensity    score was estimated in this application using a Probit model<a name=nr12></a><sup><a href="#12">12</a></sup>.    Since the probability of observing two units with exactly the same value of    the propensity score is in principle zero since p(X) is a continuous variable,    various methods have been developed in previous literature (for a summary, see    Cameron <i>et al</i>. 2005) to match comparison units sufficiently close to    the treated units. In the present paper, after estimating p(X) we employed the    Kernel Matching method.<a name=nr13></a><sup><a href="#13">13</a></sup></font></p>     <p><font face="Verdana, Arial, Helvetica, sans-serif" size="2">The tables below    show the result:</font></p>     <p>&nbsp;</p>     <p align="center"><img src="/img/revistas/s_ceco/v1nse/a02tab05.gif"></p>     <p>&nbsp;</p>     <p>&nbsp;</p>     <p align="center"><img src="/img/revistas/s_ceco/v1nse/a02tab06.gif"></p>     ]]></body>
<body><![CDATA[<p>&nbsp;</p>     <p>&nbsp;</p>     <p align="center"><img src="/img/revistas/s_ceco/v1nse/a02tab07.gif"></p>     <p>&nbsp;</p>     <p>&nbsp;</p>     <p align="center"><img src="/img/revistas/s_ceco/v1nse/a02tab08.gif"></p>     <p>&nbsp;</p>     <p>&nbsp;</p>     <p align="center"><img src="/img/revistas/s_ceco/v1nse/a02tab09.gif"></p>     <p>&nbsp;</p>     ]]></body>
<body><![CDATA[<p>&nbsp;</p>     <p align="center"><img src="/img/revistas/s_ceco/v1nse/a02tab10.gif"></p>     <p>&nbsp;</p>     <p><font face="Verdana, Arial, Helvetica, sans-serif" size="2">In the case of    men, though the "Average Effect of Treatment (got married) on the Treated"    is positive at a 90 percent, the 95 percent confidence interval includes zero.    In the case of women, the point estimates indicate that being married increases    happiness and it is significantly different from zero. Thus, data suggest positive    association between being married and happiness, especially in the case of women    above the age of 59.</font></p>     <p><font face="Verdana, Arial, Helvetica, sans-serif" size="2">As we said in the    beginning of this section, the matching method attempts to made comparisons    between treated and control individuals who are as similar as possible. Thus,    in order to gauge the goodness of the matching, we built the tables below. The    similarity between the treated and control individuals can be seen in the mean    comparison test (t-test) shown on the table: there is no statistically significant    difference in the characteristics of the treated and control matched individuals.</font></p>     <p>&nbsp;</p>     <p><font face="Verdana, Arial, Helvetica, sans-serif" size="3"><b>CONCLUSION</b></font></p>     <p><font face="Verdana, Arial, Helvetica, sans-serif" size="2">We performed empirical    analysis in order to test various happiness theories on a group of older people    in a Latin American country. In particular, we analyzed data from Uruguay gathered    by SABE.</font></p>     <p><font face="Verdana, Arial, Helvetica, sans-serif" size="2">We find that older    people in Uruguay have a tendency to report themselves happy when they are married,    when they have higher standards of health and when they earn higher levels of    income. However, the relationship between income and happiness is far stronger    in the case of women than when men are asked. When we analyze the impact of    health and income on happiness we include variables indicating absolute and    relative indications. Results indicate that accounting for relative positions    improves our understanding of those factors affecting happiness. This implies    that individuals often compare themselves with their reference groups.</font></p>     <p><font face="Verdana, Arial, Helvetica, sans-serif" size="2">Individuals report    lower levels of happiness when they live alone and when their nutrition is insufficient.    In the case of nutrition, we included a variable indicating malnutrition while    the individual was a child and also a dummy variable signaling whether the person    eats one meal a day or less. We also find that education has no clear impact    on happiness.</font></p>     ]]></body>
<body><![CDATA[<p><font face="Verdana, Arial, Helvetica, sans-serif" size="2">Obtained results    are robust to different methodological strategies. Most observed relationships    are consistent with those present in the literature. In this sense, our work    is a contribution to exploring those factors that affect individual happiness    in Latin American countries, with a special focus on the elderly and their particularities.</font></p>     <p><font face="Verdana, Arial, Helvetica, sans-serif" size="2">Our study presents    various limitations. Our future efforts will focus on three aspects: 1) to extend    analyses to additional countries (Brazil, Argentina, Chile, and Mexico); 2)    to incorporate additional semiparametric analysis of the relationships; and    3) to incorporate enhanced analysis of endogeneity.</font></p>     <p>&nbsp;</p>     <p><font face="Verdana, Arial, Helvetica, sans-serif" size="3"><b>FOOTNOTES</b></font></p>     <p><font face="Verdana, Arial, Helvetica, sans-serif" size="2"><a href="#nr1">1</a><a name=1></a> For the US, they present data by state.</font></p>     <p><font face="Verdana, Arial, Helvetica, sans-serif" size="2"><a href="#nr2">2</a><a name=2></a> The survey includes information for Argentina, Barbados, Brazil, Chile,    Cuba, Mexico and Uruguay.</font></p>     <p><font face="Verdana, Arial, Helvetica, sans-serif" size="2"><a href="#nr3">3</a><a name=3></a> Health takes the rank of values from 2 to 8, where superior values    indicate worse health.</font></p>     <p><font face="Verdana, Arial, Helvetica, sans-serif" size="2"><a href="#nr4">4</a><a name=4></a> Compared Health takes the values 1, 2 and 3, where superior values    indicates worse health subjectively compared with other people of similar age.</font></p>     <p><font face="Verdana, Arial, Helvetica, sans-serif" size="2"><a href="#nr5">5</a><a name=5></a> Although SABE has an "Income" chapter, data on income is    rather incomplete in the Uruguayan survey.</font></p>     <p><font face="Verdana, Arial, Helvetica, sans-serif" size="2"><a href="#nr6">6</a><a name=6></a> Health takes the rank of values from 2 to 8, where superior values    indicate worse health.</font></p>     ]]></body>
<body><![CDATA[<p><font face="Verdana, Arial, Helvetica, sans-serif" size="2"><a href="#nr7">7</a><a name=7></a> Compared Health takes the values 1, 2 and 3, where superior values    indicates worse health subjectively compared with other people of similar age.</font></p>     <p><font face="Verdana, Arial, Helvetica, sans-serif" size="2"><a href="#nr8">8</a><a name=8></a> Income aspirations reflect people's perception about them having enough    money for paying their daily expenses. Clearly, there is an objective, but also    a subjective component in this perception.</font></p>     <p><font face="Verdana, Arial, Helvetica, sans-serif" size="2"><a href="#nr9">9</a><a name=9></a> We do this to avoid difficulties in defining "reference groups".</font></p>     <p><font face="Verdana, Arial, Helvetica, sans-serif" size="2"><a href="#nr10">10</a><a name=10></a> In the empirical application of this paper, we use robust standard    errors in OLS, Probit, and Tobit models to cope with the possible existence    of heteroskedasticity.</font></p>     <p><font face="Verdana, Arial, Helvetica, sans-serif" size="2"><a href="#nr11">11</a><a name=11></a> We only capture the effect of current marital status. Thus, our interpretation    refers to whether the individual is married today or not.</font></p>     <p><font face="Verdana, Arial, Helvetica, sans-serif" size="2"><a href="#nr12">12</a><a name=12></a> Applied with the Stata ado file "pscore" developed by Becker    and Ichino (2002).</font></p>     <p><font face="Verdana, Arial, Helvetica, sans-serif" size="2"><a href="#nr13">13</a><a name=13></a> This matching method was applied using the Stata ado file "psmatch2"    developed by Leuven and Sianesi (2003).</font></p>     <p><font face="Verdana, Arial, Helvetica, sans-serif" size="2"><a href="#nr14">14</a><a name=14></a> This Mean Comparison Test (t-tests for equality of means in the treated    and non-treated groups, both before and after matching) was applied using the    Stata ado file "pstest" developed by Leuven and Sianesi (2003).</font></p>     <p>&nbsp;</p>     <p><font face="Verdana, Arial, Helvetica, sans-serif" size="3"><b>REFERENCES</b></font></p>     ]]></body>
<body><![CDATA[<!-- ref --><p> 1. Alesina, A.; Di Tella, R. and MacCulloch, R. (2004). &quot;Inequality and    happiness: are Europeans and Americans different? &quot; <i>Journal of Public    Economics</i>, 88 (2004): 2009-2042.    </p>     <!-- ref --><p> 2. Argyle, M. (1997). <i>The Psychology of Religious Behaviour, Belief and    Experience</i>. London - New York: Routledge.    </p>     <!-- ref --><p> 3. Argyle, M. (2002). <i>The Psychology of Happiness</i>. London - New York:    Routledge.    </p>     <!-- ref --><p> 4. Becker, S. and Ichino, A. (2002). &quot;Estimation of average treatment    effects based on propensity scores&quot;. <i>The Stata Journal</i>, 2 (4): 358-377.    </p>     <!-- ref --><p> 5. Blanchflower, D. and Oswald, A. J. (2004). &quot;Well-being over time in    Britain and the United States&quot;. <i>Journal of Public Economics</i>, 88    (7-8): 1359-1386.    </p>     ]]></body>
<body><![CDATA[<!-- ref --><p> 6. Bucheli, M. and Rossi, M. (2003). &quot;El grado de conformidad con la    vida: evidencia para las mujeres del Gran Montevideo.&quot; <i>Documento</i>    <i>N° 10/03</i>. Departamento de Economía. Facultad de Ciencias Sociales. Universidad    de la República.    </p>     <!-- ref --><p> 7. Clark, A. E. and Oswald, A. J. (1994). &quot;Unhappiness and Unemployment&quot;.    <i>The Economic Journal</i>, 104 (424): 648-659.    </p>     <!-- ref --><p> 8. Cameron, A. C. and Trivedi, P. K. (2005). &quot;Microeconometrics. Methods    and Applications&quot;. Cambridge: Cambridge University Press.    </p>     <!-- ref --><p> 9. Chay, K. Y. and Powell, J. L. (2001). &quot;Semiparametric Censored Regression    Models&quot;. <i>Journal of Economic Perspectives</i>. 15 (4): 29-42.    </p>     <!-- ref --><p> 10. Cruz, J. and Torres, J. (2006) &quot;¿De qué depende la satisfacción subjetiva    de los colombianos? &quot; <i>Cuadernos de Economía</i>, 25 (45): 131-154.    </p>     ]]></body>
<body><![CDATA[<!-- ref --><p> 11. Diener, E. (1985). &quot;The Satisfaction With Life Scale&quot;. <i>Journal    of Personality Assessment</i>, 49 (1): 71-75.    </p>     <!-- ref --><p> 12. Diener, E. and Suh, E (Editors) (2000). <i>Culture and Subjective Well-Being    (Well Being and Quality of Life)</i>. Cambridge MA: MIT Press.    </p>     <!-- ref --><p> 13. Frey, B. and Stutzer, A. (2002). &quot;What can Economists learn from    Happiness Research? &quot; <i>Journal of Economic Literature</i>, 40 (2): 402-435.    </p>     <!-- ref --><p> 14. Frey, B. and Stutzer, A. (2003). Testing Theories of Happiness. Institute    for Empirical Research in Economics. <i>Working Paper Series</i>, 147. University    of Zurich<!-- ref --><p> 15. Gerdtham, U and Johanesson, M. (1997). &quot;The relationship between    happiness, health and socio-economic factors: results based on Swedish micro    data&quot;. <i>Working Paper Series in Economics and Finance</i>, No. 27. Department    of Economics, Stockholm School of Economics, Stockholm, Sweden.    </p>     <!-- ref --><p> 16. Gerstenbluth, M., Rossi, M. and Triunfo, P. (2007). &quot;Felicidad y    salud: Una aproximación al bienestar en el Río de la Plata&quot;. <i>Documento    de Trabajo</i> <i>15/07</i>. Departamento de Economía, Facultad de Ciencias    Sociales, Universidad de la República.    </p>     <!-- ref --><p> 17. Graham, C. and Felton, A. (2005). &quot;Does Inequality Matter to Individual    Welfare? An initial exploration based on happiness surveys from Latin America&quot;.    <i>Working Paper</i>, 38. The Brookings Institution. Center on Social and Economic    Dynamics.    </p>     <!-- ref --><p> 18. Honoré, Bo E. and Powell, J. L. (1994). &quot;Pairwise Difference Estimators    for Censored and Truncated Regression Models&quot;. <i>Journal of Econometrics</i>,    64 (1-2): 241-78, September/October.    </p>     <!-- ref --><p> 19. Layard, R. (1980). &quot;Human Satisfactions and Public Policy&quot;.    <i>The Economic Journal</i>, 90 (360): 737-750.    </p>     <!-- ref --><p> 20. Layard, R. (2005). <i>Happiness: Lessons from a New Science</i>. London:    Penguin Books.    </p>     <!-- ref --><p> 21. Leuven, E. and Sianesi, B. (2003). &quot;PSMATCH2: Stata module to perform    full Mahalanobis and propensity score matching, common support graphing, and    covariate imbalance testing&quot;. Boston College Department of Economics, Statistical    Software Components.    </p>     <!-- ref --><p> 22. Oswald, A. (1997). &quot;Happiness and Economic Performance&quot;. <i>The    Economic Journal</i>, 107 (445): 1815-1831.    </p>     <!-- ref --><p> 23. Powell, J. L. (1984). &quot;Least Absolute Deviations Estimation for the    Censored Regression Model&quot;. <i>Journal of Econometrics</i>, 25 (3): 303-25,    July.    </p>     <!-- ref --><p> 24. Powell, J. L. (1986). &quot;Symmetrically Trimmed Least Squares Estimation    for Tobit Models&quot;. <i>Econometrica</i>, 54 (6): 1435-60. November.    </p>     <!-- ref --><p> 25. Stack, S. and Eshleman, J. R. (1998). &quot;Marital Status and Happiness:    A 17-Nation Study&quot;. <i>Journal of Marriage and the Family</i>, 60 (2):    527-536, May.    </p>     <!-- ref --><p> 26. Rosenbaum, P. and Rubin, D. (1983). &quot;The central role of the propensity    score in observational studies for causal effects&quot;. <i>Biometrika</i>,    70 (1): 41-55.    </p>      <p>&nbsp;</p>     <p><font face="Verdana, Arial, Helvetica, sans-serif" size="2">Este artículo fue    recibido el 11 de diciembre de 2007 y su publicación aprobada el 19 de marzo    de 2008. </font></p>     <p>&nbsp;</p>     <p>&nbsp;</p>     <p><font face="Verdana, Arial, Helvetica, sans-serif" size="2"><a name="app"></a><b>Appendix    A</b></font></p>     <p><font face="Verdana, Arial, Helvetica, sans-serif" size="2">In our work we    deal with a major issue: a high number of no responses to income related questions    in the SABE survey. In order to deal with this situation we estimated individual    income using data from Encuesta Continua de Hogares (ECH, the Uruguayan household    survey). We conducted different estimations for men and for women.</font></p>     <p><font face="Verdana, Arial, Helvetica, sans-serif" size="2">We regressed (the    logarithm of) per capita income against a set of individual and socioeconomic    variables using ECH data. Our major challenge consisted in selecting those independent    variables that we could identify both in the ECH and in the SABE survey. In    particular independent variables included indications of age, gender, family    composition, educational level, employment status, sources of income and the    ownership of different kinds of durable goods. In the case of men, our regression    had an R<sup>2</sup> of 0.67; in the case of women, R<sup>2</sup> was 0.65.</font></p>     <p><font face="Verdana, Arial, Helvetica, sans-serif" size="2">Once we obtained    the income estimations from ECH we predicted individual income for the SABE    respondents. In our prediction, we utilized those coefficients obtained in our    initial estimation in order to express the relationship between individual variables    and income levels.</font></p>      ]]></body><back>
<ref-list>
<ref id="B1">
<label>1</label><nlm-citation citation-type="journal">
<person-group person-group-type="author">
<name>
<surname><![CDATA[Alesina]]></surname>
<given-names><![CDATA[A]]></given-names>
</name>
<name>
<surname><![CDATA[Di Tella]]></surname>
<given-names><![CDATA[R]]></given-names>
</name>
<name>
<surname><![CDATA[MacCulloch]]></surname>
<given-names><![CDATA[R]]></given-names>
</name>
</person-group>
<article-title xml:lang="en"><![CDATA[Inequality and happiness: are Europeans and Americans different?]]></article-title>
<source><![CDATA[Journal of Public Economics]]></source>
<year>2004</year>
<month>20</month>
<day>04</day>
<volume>88</volume>
<page-range>2009-2042</page-range></nlm-citation>
</ref>
<ref id="B2">
<label>2</label><nlm-citation citation-type="book">
<person-group person-group-type="author">
<name>
<surname><![CDATA[Argyle]]></surname>
<given-names><![CDATA[M]]></given-names>
</name>
</person-group>
<source><![CDATA[The Psychology of Religious Behaviour, Belief and Experience]]></source>
<year>1997</year>
<publisher-loc><![CDATA[LondonNew York ]]></publisher-loc>
<publisher-name><![CDATA[Routledge]]></publisher-name>
</nlm-citation>
</ref>
<ref id="B3">
<label>3</label><nlm-citation citation-type="book">
<person-group person-group-type="author">
<name>
<surname><![CDATA[Argyle]]></surname>
<given-names><![CDATA[M]]></given-names>
</name>
</person-group>
<source><![CDATA[The Psychology of Happiness]]></source>
<year>2002</year>
<publisher-loc><![CDATA[LondonNew York ]]></publisher-loc>
<publisher-name><![CDATA[Routledge]]></publisher-name>
</nlm-citation>
</ref>
<ref id="B4">
<label>4</label><nlm-citation citation-type="journal">
<person-group person-group-type="author">
<name>
<surname><![CDATA[Becker]]></surname>
<given-names><![CDATA[S]]></given-names>
</name>
<name>
<surname><![CDATA[Ichino]]></surname>
<given-names><![CDATA[A]]></given-names>
</name>
</person-group>
<article-title xml:lang="en"><![CDATA[Estimation of average treatment effects based on propensity scores]]></article-title>
<source><![CDATA[The Stata Journal]]></source>
<year>2002</year>
<volume>2</volume>
<numero>4</numero>
<issue>4</issue>
<page-range>358-377</page-range></nlm-citation>
</ref>
<ref id="B5">
<label>5</label><nlm-citation citation-type="journal">
<person-group person-group-type="author">
<name>
<surname><![CDATA[Blanchflower]]></surname>
<given-names><![CDATA[D]]></given-names>
</name>
<name>
<surname><![CDATA[Oswald]]></surname>
<given-names><![CDATA[A. J]]></given-names>
</name>
</person-group>
<article-title xml:lang="en"><![CDATA[Well-being over time in Britain and the United States]]></article-title>
<source><![CDATA[Journal of Public Economics]]></source>
<year>2004</year>
<volume>88</volume>
<numero>7-8</numero>
<issue>7-8</issue>
<page-range>1359-1386</page-range></nlm-citation>
</ref>
<ref id="B6">
<label>6</label><nlm-citation citation-type="journal">
<person-group person-group-type="author">
<name>
<surname><![CDATA[Bucheli]]></surname>
<given-names><![CDATA[M]]></given-names>
</name>
<name>
<surname><![CDATA[Rossi]]></surname>
<given-names><![CDATA[M]]></given-names>
</name>
</person-group>
<article-title xml:lang="es"><![CDATA[El grado de conformidad con la vida: evidencia para las mujeres del Gran Montevideo]]></article-title>
<source><![CDATA[Documento]]></source>
<year>2003</year>
<volume>03</volume>
<numero>N° 10</numero>
<issue>N° 10</issue>
<publisher-name><![CDATA[Departamento de Economía. Facultad de Ciencias Sociales. Universidad de la República]]></publisher-name>
</nlm-citation>
</ref>
<ref id="B7">
<label>7</label><nlm-citation citation-type="journal">
<person-group person-group-type="author">
<name>
<surname><![CDATA[Clark]]></surname>
<given-names><![CDATA[A. E]]></given-names>
</name>
<name>
<surname><![CDATA[Oswald]]></surname>
<given-names><![CDATA[A. J]]></given-names>
</name>
</person-group>
<article-title xml:lang="en"><![CDATA[Unhappiness and Unemployment]]></article-title>
<source><![CDATA[The Economic Journal]]></source>
<year>1994</year>
<volume>104</volume>
<numero>424</numero>
<issue>424</issue>
<page-range>648-659</page-range></nlm-citation>
</ref>
<ref id="B8">
<label>8</label><nlm-citation citation-type="book">
<person-group person-group-type="author">
<name>
<surname><![CDATA[Cameron]]></surname>
<given-names><![CDATA[A. C]]></given-names>
</name>
<name>
<surname><![CDATA[Trivedi]]></surname>
<given-names><![CDATA[P. K]]></given-names>
</name>
</person-group>
<source><![CDATA[Microeconometrics. Methods and Applications]]></source>
<year>2005</year>
<publisher-loc><![CDATA[Cambridge ]]></publisher-loc>
<publisher-name><![CDATA[Cambridge University Press]]></publisher-name>
</nlm-citation>
</ref>
<ref id="B9">
<label>9</label><nlm-citation citation-type="journal">
<person-group person-group-type="author">
<name>
<surname><![CDATA[Chay]]></surname>
<given-names><![CDATA[K. Y]]></given-names>
</name>
<name>
<surname><![CDATA[Powell]]></surname>
<given-names><![CDATA[J. L]]></given-names>
</name>
</person-group>
<article-title xml:lang="en"><![CDATA[Semiparametric Censored Regression Models]]></article-title>
<source><![CDATA[Journal of Economic Perspectives.]]></source>
<year>2001</year>
<volume>15</volume>
<numero>4</numero>
<issue>4</issue>
<page-range>29-42</page-range></nlm-citation>
</ref>
<ref id="B10">
<label>10</label><nlm-citation citation-type="journal">
<person-group person-group-type="author">
<name>
<surname><![CDATA[Cruz]]></surname>
<given-names><![CDATA[J]]></given-names>
</name>
<name>
<surname><![CDATA[Torres]]></surname>
<given-names><![CDATA[J]]></given-names>
</name>
</person-group>
<article-title xml:lang="es"><![CDATA[¿De qué depende la satisfacción subjetiva de los colombianos?]]></article-title>
<source><![CDATA[Cuadernos de Economía]]></source>
<year>2006</year>
<volume>25</volume>
<numero>45</numero>
<issue>45</issue>
<page-range>131-154</page-range></nlm-citation>
</ref>
<ref id="B11">
<label>11</label><nlm-citation citation-type="journal">
<person-group person-group-type="author">
<name>
<surname><![CDATA[Diener]]></surname>
<given-names><![CDATA[E]]></given-names>
</name>
</person-group>
<article-title xml:lang="en"><![CDATA[The Satisfaction With Life Scale]]></article-title>
<source><![CDATA[of Personality Assessment]]></source>
<year>1985</year>
<volume>49</volume>
<numero>1</numero>
<issue>1</issue>
<page-range>71-75</page-range></nlm-citation>
</ref>
<ref id="B12">
<label>12</label><nlm-citation citation-type="book">
<person-group person-group-type="author">
<name>
<surname><![CDATA[Diener]]></surname>
<given-names><![CDATA[E]]></given-names>
</name>
<name>
<surname><![CDATA[Suh]]></surname>
<given-names><![CDATA[E]]></given-names>
</name>
</person-group>
<source><![CDATA[Culture and Subjective Well-Being (Well Being and Quality of Life)]]></source>
<year>2000</year>
<publisher-loc><![CDATA[Cambridge^eMA MA]]></publisher-loc>
<publisher-name><![CDATA[MIT Press]]></publisher-name>
</nlm-citation>
</ref>
<ref id="B13">
<label>13</label><nlm-citation citation-type="journal">
<person-group person-group-type="author">
<name>
<surname><![CDATA[Frey]]></surname>
<given-names><![CDATA[B]]></given-names>
</name>
<name>
<surname><![CDATA[Stutzer]]></surname>
<given-names><![CDATA[A]]></given-names>
</name>
</person-group>
<article-title xml:lang="en"><![CDATA[What can Economists learn from Happiness Research?]]></article-title>
<source><![CDATA[Journal of Economic Literature]]></source>
<year>2002</year>
<volume>40</volume>
<numero>2</numero>
<issue>2</issue>
<page-range>402-435</page-range></nlm-citation>
</ref>
<ref id="B14">
<label>14</label><nlm-citation citation-type="journal">
<person-group person-group-type="author">
<name>
<surname><![CDATA[Frey]]></surname>
<given-names><![CDATA[B]]></given-names>
</name>
<name>
<surname><![CDATA[Stutzer]]></surname>
<given-names><![CDATA[A]]></given-names>
</name>
</person-group>
<article-title xml:lang="en"><![CDATA[Testing Theories of Happiness]]></article-title>
<source><![CDATA[Working Paper Series,]]></source>
<year>2003</year>
<numero>147</numero>
<issue>147</issue>
<publisher-name><![CDATA[University of Zurich]]></publisher-name>
</nlm-citation>
</ref>
<ref id="B15">
<label>15</label><nlm-citation citation-type="journal">
<person-group person-group-type="author">
<name>
<surname><![CDATA[Gerdtham]]></surname>
<given-names><![CDATA[U]]></given-names>
</name>
<name>
<surname><![CDATA[Johanesson]]></surname>
<given-names><![CDATA[M]]></given-names>
</name>
</person-group>
<article-title xml:lang="en"><![CDATA[The relationship between happiness, health and socio-economic factors: results based on Swedish micro data]]></article-title>
<source><![CDATA[Working Paper Series in Economics and Finance]]></source>
<year>1997</year>
<numero>27</numero>
<issue>27</issue>
<publisher-loc><![CDATA[Stockholm ]]></publisher-loc>
<publisher-name><![CDATA[Department of Economics, Stockholm School of Economics]]></publisher-name>
</nlm-citation>
</ref>
<ref id="B16">
<label>16</label><nlm-citation citation-type="journal">
<person-group person-group-type="author">
<name>
<surname><![CDATA[Gerstenbluth]]></surname>
<given-names><![CDATA[M]]></given-names>
</name>
<name>
<surname><![CDATA[Rossi]]></surname>
<given-names><![CDATA[M]]></given-names>
</name>
<name>
<surname><![CDATA[Triunfo]]></surname>
<given-names><![CDATA[P]]></given-names>
</name>
</person-group>
<article-title xml:lang="es"><![CDATA[Felicidad y salud: Una aproximación al bienestar en el Río de la Plata]]></article-title>
<source><![CDATA[Documento de Trabajo]]></source>
<year>2007</year>
<numero>15/07</numero>
<issue>15/07</issue>
<publisher-name><![CDATA[Departamento de Economía, Facultad de Ciencias Sociales, Universidad de la República]]></publisher-name>
</nlm-citation>
</ref>
<ref id="B17">
<label>17</label><nlm-citation citation-type="journal">
<person-group person-group-type="author">
<name>
<surname><![CDATA[Graham]]></surname>
<given-names><![CDATA[C]]></given-names>
</name>
<name>
<surname><![CDATA[Felton]]></surname>
<given-names><![CDATA[A]]></given-names>
</name>
</person-group>
<article-title xml:lang="en"><![CDATA[Does Inequality Matter to Individual Welfare? An initial exploration based on happiness surveys from Latin America]]></article-title>
<source><![CDATA[Working Paper]]></source>
<year></year>
<numero>38</numero>
<issue>38</issue>
<publisher-name><![CDATA[The Brookings Institution. Center on Social and Economic Dynamics]]></publisher-name>
</nlm-citation>
</ref>
<ref id="B18">
<label>18</label><nlm-citation citation-type="journal">
<person-group person-group-type="author">
<name>
<surname><![CDATA[Honoré]]></surname>
<given-names><![CDATA[Bo E]]></given-names>
</name>
<name>
<surname><![CDATA[Powell]]></surname>
<given-names><![CDATA[J. L]]></given-names>
</name>
</person-group>
<article-title xml:lang="en"><![CDATA[Pairwise Difference Estimators for Censored and Truncated Regression Models]]></article-title>
<source><![CDATA[Journal of Econometrics]]></source>
<year>1994</year>
<volume>64</volume>
<numero>1-2</numero>
<issue>1-2</issue>
<page-range>241-78</page-range></nlm-citation>
</ref>
<ref id="B19">
<label>19</label><nlm-citation citation-type="journal">
<person-group person-group-type="author">
<name>
<surname><![CDATA[Layard]]></surname>
<given-names><![CDATA[R]]></given-names>
</name>
</person-group>
<article-title xml:lang="en"><![CDATA[Human Satisfactions and Public Policy]]></article-title>
<source><![CDATA[The Economic Journal]]></source>
<year>1980</year>
<volume>90</volume>
<numero>360</numero>
<issue>360</issue>
<page-range>737-750</page-range></nlm-citation>
</ref>
<ref id="B20">
<label>20</label><nlm-citation citation-type="book">
<person-group person-group-type="author">
<name>
<surname><![CDATA[Layard]]></surname>
<given-names><![CDATA[R]]></given-names>
</name>
</person-group>
<source><![CDATA[Happiness: Lessons from a New Science]]></source>
<year>2005</year>
<publisher-loc><![CDATA[London ]]></publisher-loc>
<publisher-name><![CDATA[Penguin Books]]></publisher-name>
</nlm-citation>
</ref>
<ref id="B21">
<label>21</label><nlm-citation citation-type="book">
<person-group person-group-type="author">
<name>
<surname><![CDATA[Leuven]]></surname>
<given-names><![CDATA[E]]></given-names>
</name>
<name>
<surname><![CDATA[Sianesi]]></surname>
<given-names><![CDATA[B]]></given-names>
</name>
</person-group>
<source><![CDATA[PSMATCH2: Stata module to perform full Mahalanobis and propensity score matching, common support graphing, and covariate imbalance testing]]></source>
<year>2003</year>
<publisher-name><![CDATA[Boston College Department of Economics]]></publisher-name>
</nlm-citation>
</ref>
<ref id="B22">
<label>22</label><nlm-citation citation-type="journal">
<person-group person-group-type="author">
<name>
<surname><![CDATA[Oswald]]></surname>
<given-names><![CDATA[A]]></given-names>
</name>
</person-group>
<article-title xml:lang="en"><![CDATA[Happiness and Economic Performance]]></article-title>
<source><![CDATA[The Economic Journal]]></source>
<year>1997</year>
<volume>107</volume>
<numero>445</numero>
<issue>445</issue>
<page-range>1815-1831</page-range></nlm-citation>
</ref>
<ref id="B23">
<label>23</label><nlm-citation citation-type="journal">
<person-group person-group-type="author">
<name>
<surname><![CDATA[Powell]]></surname>
<given-names><![CDATA[J. L]]></given-names>
</name>
</person-group>
<article-title xml:lang="en"><![CDATA[Least Absolute Deviations Estimation for the Censored Regression Model]]></article-title>
<source><![CDATA[Journal of Econometrics]]></source>
<year>1984</year>
<volume>25</volume>
<numero>3</numero>
<issue>3</issue>
<page-range>303-25</page-range></nlm-citation>
</ref>
<ref id="B24">
<label>24</label><nlm-citation citation-type="journal">
<person-group person-group-type="author">
<name>
<surname><![CDATA[Powell]]></surname>
<given-names><![CDATA[J. L]]></given-names>
</name>
</person-group>
<article-title xml:lang="en"><![CDATA[Symmetrically Trimmed Least Squares Estimation for Tobit Models]]></article-title>
<source><![CDATA[Econometrica]]></source>
<year>1986</year>
<volume>54</volume>
<numero>6</numero>
<issue>6</issue>
<page-range>1435-60</page-range></nlm-citation>
</ref>
<ref id="B25">
<label>25</label><nlm-citation citation-type="journal">
<person-group person-group-type="author">
<name>
<surname><![CDATA[Stack]]></surname>
<given-names><![CDATA[S]]></given-names>
</name>
<name>
<surname><![CDATA[Eshleman]]></surname>
<given-names><![CDATA[J. R]]></given-names>
</name>
</person-group>
<article-title xml:lang="en"><![CDATA[Marital Status and Happiness: A 17-Nation Study]]></article-title>
<source><![CDATA[Journal of Marriage and the Family]]></source>
<year>1998</year>
<volume>60</volume>
<numero>2</numero>
<issue>2</issue>
<page-range>527-536</page-range></nlm-citation>
</ref>
<ref id="B26">
<label>26</label><nlm-citation citation-type="journal">
<person-group person-group-type="author">
<name>
<surname><![CDATA[Rosenbaum]]></surname>
<given-names><![CDATA[P]]></given-names>
</name>
<name>
<surname><![CDATA[Rubin]]></surname>
<given-names><![CDATA[D]]></given-names>
</name>
</person-group>
<article-title xml:lang="en"><![CDATA[The central role of the propensity score in observational studies for causal effects]]></article-title>
<source><![CDATA[Biometrika]]></source>
<year>1983</year>
<volume>70</volume>
<numero>1</numero>
<issue>1</issue>
<page-range>41-55</page-range></nlm-citation>
</ref>
</ref-list>
</back>
</article>
