


Mi SciELO
 Servicios personalizados
 Inglés (pdf)
 Articulo en XML
 Referencias del artículo
 Enviar articulo por email
 Citado por SciELO

 Permalink
Cadernos Pagu
versión impresa ISSN 0104-8333
Cad. Pagu vol.2 no.se Campinas 2010
Labor as a determinant of school discrepancy in Brazil: myth or reality?*
Amélia Cristina Abreu Artes**; Marília Pinto de Carvalho***
Translated by Thaddeus Gregory Blanchette
Translated from Cadernos Pagu, Campinas, n.34, p. 41-74, Jun. 2010.
ABSTRACT
The purpose of this article is to evaluate the labor influence on schooling results considering the micro data from the PNAD 2006 (National Residence Sample Survey). A statistical model was developed, aiming to explain the school discrepancy between age and years of study from a sex variable and considering the labor factor as a control variable. The results indicate that labor damages the boys' schooling process more effectively than the housework affects the girls, with worse results for black boys and girls, but this variable alone cannot explain the greater school discrepancy in male subjects.
Key Words:Â Gender, Children's Labor, Discrepancy, Boys, Masculinity.
RESUMO
Este artigo tem por objetivo avaliar a influência do trabalho nas trajetórias escolares a partir dos microdados da Pesquisa Nacional de Amostra por Domicílio - PNAD 2006. Desenvolve-se uma modelagem estatística, visando explicar a defasagem entre idade e anos de estudo a partir da variável sexo e considerando o fator trabalho como variável de controle. Os resultados indicam que o trabalho prejudica o percurso escolar mais intensamente para os meninos e os afazeres domésticos de forma mais sutil para as meninas, com resultados piores para os negros de ambos os sexos, mas somente essa variável não explica a maior defasagem escolar do sexo masculino.
Palavras-chave: Gênero, Trabalho Infanto-juvenil, Defasagem Escolar, Meninos, Masculinidade.
International data show that in poor and developing countries mainly located in Africa and Southwestern Asia, the girls' schooling presents worse indexes than the boys' (Global Monitoring Report - Relatório de Monitoramento Global - RMG, UNESCO, 2004). On the other hand, when analyzing the Brazilian and Latin American educational system realities, the educational differences are more favorable to the girls. (among others, see Carvalho, 2001; Rosemberg, 1990; Ferraro, 2006).
One of the most frequently raised explanations, when the more tumultuous schooling paths of boys and young men in Brazil are observed, is the fact that they occupy a greater place in the labor world (Kassouf, 2007; Rocha, 2003; Schwartzman, 2004). But could this be the only or main explanation to the boys' poorer school performance? Could there be other factors?
This article explores the data from the National Residence Sample Survey (Pesquisa Nacional por Amostra de Domicílios) - PNAD 2006, using the information on discrepancy between age and years of study used as indicator of the schooling path, comparing boys and girls from 10 to 14 years old. The choice for an efficiency and outcome indicator is due to the appreciation intended to the schooling paths. The PNAD database presents as a derived variable the schooling years of the population, also used by Ferraro (2002, 2007a, 2007b).1
In order to understand the boys and their unfavorable condition compared to the girls', a theoretical posture which can go beyond the pre-established ideas is required, since the gender concept was built from the feminist movement which was aimed to give visibility to women who sought equal rights and conditions, emphasizing the power relationships (Rosemberg, 2002). If the concept of gender which supports this analysis seeks to move away from a simple biological perception, considering that the observed differences between boys and girls have social constructions of masculinity and femininity historically defined (Scott, 1995), this approach also questions a bipolar vision of sexes, which start to be seen internally as non homogenous blocks. According to Carvalho (1999:32), "the excluding polarity or the binary  opposition is not the only way of apprehending the difference, nor is the emphasis in difference the only way of understanding men and women".
This idea allowed us to investigate which boys and young men were failing at school. In these terms, we separated the groups according to sex, indicating how the other variables intervene as a whole in the production of the girls' successful school results.
Having established that, we cannot say that there are gender indicators, but sex indicators, since the quantitative researches refer to the subject's sex, not its social space, that is, its place in the gender relations. This way, the variable used in this research is the subjects' sex and the gender will be used as an analysis category to help explain the differences found in boys and girls' performances at school.Â
We opted to work with a 10 to 14 year-old age group, which corresponds to the final years of the fundamental schooling2, using the information available in the PNAD questionnaire.Â
Besides age, the bunch of subjects was also divided according to social and economic inequality in the different regions of the country. If the international studies demonstrate that in the poor regions of the world, girls have a hard time accessing education (RMG, UNESCO, 2004), could the reality be the same in Brazil? Apparently not. Beltrão (2002) and Ferraro (2007, 2009) indicate that, in the poorer regions of the country, the girls' better performance at school is more visible than in the richer regions. In order to better deal with these aspects, we have grouped the 27 units of the federation according to their HDI (Human Development Index) in three groups: high (better than 0.773), medium (between 0.713 and 0.773) and low (less than 0.705).3
Secondly, we have also considered the race/skin color variable which is presented to the interviewee in the PNAD according to the categories presented by IBGE (Brazilian Census) (white, black, mulatto, yellow and indian). In this article, the concept of race is used as a sociological and political - therefore non biological -, according to Costa (2002), and the data were organized this way: white and black4 (including blacks and mulattos).
Boys, girls and labor
Frequently seen as a negative thing, children and teenage labor has been considered as the main cause for poor performance at school, especially for boys, and the explanation is found in common sense and academic texts as well. That happens not only because boys enter the labor world more frequently and earlier than girls, but also because they have tasks that often impede their access to school. In 2006, according to the IBGE, 11.5% of the Brazilian kids in the 5-17 year-old age group - some 5.1 million children - were working, totalizing 5.1 million. Among these children, boys predominated. In the 10-13 year-old age group, for example, 10.5% of the boys were working as opposed to 5.8% of the girls. In the girls' case, there was no loss to schooling, because they were mainly dealing with housework which apparently, fits better to the school demands, mainly because of schedule flexibility (RMG, 2004, UNESCO).
When considering the labor variable in this analysis, thus, it is necessary to explore its different dimensions. After all, what kind of work is done by boys and girls? How do the flexibility and precarious nature of the labor relations affect each sex? Are the domestic activities not a mode of non-remunerated work?
In this article, the "domestic duties" are considered to be an activity, assuming the same status as work5, seeking to disrupt the apparent neutrality of this category and transforming it in a "sexed category" (Hirata, 2002), seeing that the domestic duties are mainly conducted by women and are associated to femininity: in Brazil, in 2007, 89.9% of women 16 years old and older declared that they were doing domestic duties as opposed to 50.7% of men (Pinheiro et alii, 2008). "This difference is reproduced in both rural and urban areas, among both blacks and whites, and in all regions of the country" (Id. ib: 35). Aside from this, while women dedicated an average of 27.2 hours a week to those activities, men dedicated almost three times less hours: 10.6 hours a week. Cristina Bruschini (2006) analyses the domestic work as an "economic non-activity", or as unpaid work. According to this author, girls in the 10-14 age bracket dedicated approximately 14 hours a week to domestic activities while boys dedicated less than 9 hours. We decided to keep the expression "domestic activities" which is employed by the data from PNAD.
To such an extent, in the same way it is important to characterize the mode of work carried out by boys and girls, the same must be done to domestic activities: would the domestic activities done by men and women be different? How long would each of these groups take to do them? If boys are more present in the labor world, are girls more included in the world of domestic duties? What is the damage of each activity on the schooling results?
If there are few studies which differentiate, by sex, the schooling paths associated to the world of work, it is even rarer to find some which consider the domestic activities in their definition of work. We have observed that, while a small portion of kids in the chosen age bracket work -10.6% of the boys and 5.8% of the girls - 47% of the boys and 78% of the girls are involved in domestic activities (PNAD 2006), with significant differences in the amount of time that both sexes dedicate to these activities.
Descriptive analysis - PNAD 2006 - 10 to 14 years of age
In the 10 to 14 years of age group sample there were 39,459 subjects, with 50.9% male and 49.1% female. For the presented analysis, the sample was expanded to the entire Brazilian population6, totalizing 9,017,494 boys and 8,684,667 girls. In order to facilitate visual understanding, the tables presented below deal with these numbers in percentage terms only.
The number of blacks (including blacks and mulattos) surpasses the number of whites, in both sexes, accounting for 56.1% of the men and 55.3% of the women.
In terms of school attendance, females show a distinct advantage which decreases with age. While 99.1% of the 10 year-old girls and 98.4% of the ten-year old boys where in school, these percentages decrease to 94.1% and 93.6%, respectively, at 14 years of age. In all, some 266,675 boys (3%) and 214,440 girls (2.5%) were out of school. Cross-referencing the data regarding work and school attendance clearly shows that the greater part of the young people involved in these two activities are able to successfully combine them. Now the domestic activity is clearly associated with the girls: 78.8% of them, as opposed to 45.8% of the boys, combine this sort of activity with school.
A significant portion of this group who do not study is also out of the world of work: 28.7% of the boys and 11.7% of the girls. If work is presented as the main reason for early dropout rates from school, how do we thus explain, then, the fact that more than 76,000 boys neither work nor study? Have these boys abandoned school in order to look for work, or are other circumstances pushing them away from both options?
Table 17 presents the discrepancy age/years of study, showing that the discrepancy index increases proportionally with age. It is also observed that the discrepancy is greater for boys and that the difference is maintained as age increases. In general, 52.5% of the boys and 41.7% of the girls are behind in school.
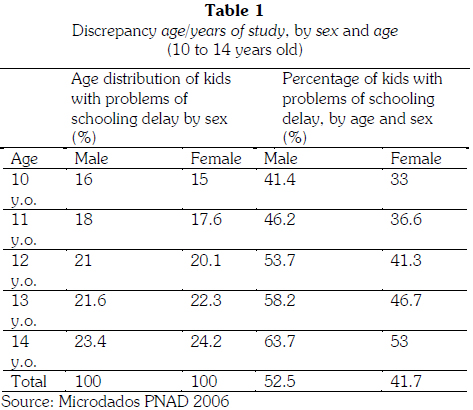
The columns on the right side of the table show that the difference in the number of boys and girls who are behind in their studies, which clearly increases with age, is constant and unfavorable to the boys.
Table 2 reveals the results for the relation between discrepancy age/years of study and race. Among the population studied, 43.9% of the boys are white and 56.1% are black, while 44.7% of the girls are white and 55.3% are black. When the discrepancy indicator was added, those indexes changed: we find that only 39.7% of the boys are white while 62.5% of the boys are black. For the girls, the difference is smaller: 32.4% of the girls are white and 49.3% are black. These results reinforce the importance of race in the process of school discrepancy, emphasized by the male vulnerability, our analysis focus.
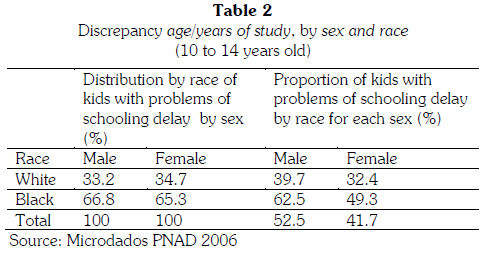
Table 3 presents the distribution according to HDI results. The right hand columns show that the discrepancy is greater for both sexes in the Federation Units (UF) with lower HDI. At the same time, the difference between boys and girls with schooling delay problems is also greater in theses regions, reinforcing the thesis that in poorer areas of the country, the boys hold the worst schooling paths.
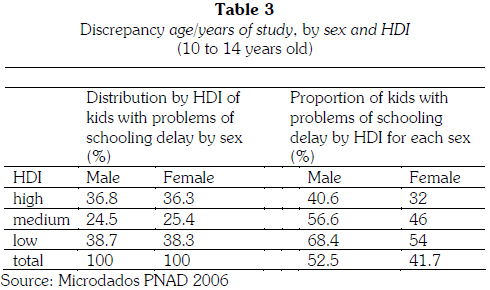
Table 4 allows us to discuss the influence of labor over discrepancy.
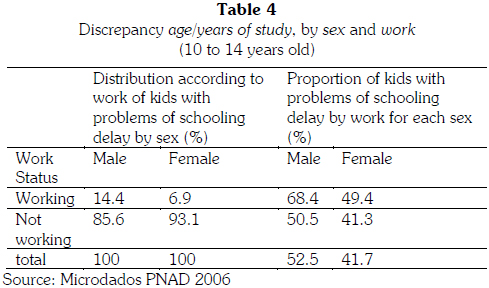
This analysis should be considered as a trend because the group of workers in the general population represents 11.1% of boys and 5.9% of girls. However, given that work is invoked in literature as the main excuse for the worsening of the boys' educational indexes, these descriptive results might help explain the influence of work on discrepancy, which will be explained in the statistical analysis presented below.
The index of kids behind in school increases significantly for the group of workers. In the portion of population focused here, 52.5% of the boys and 41.7% of the girls have problems of schooling delay, while in the group of workers, the index climbs to 68.4% of the boys and 49.4% of the girls. In another perspective, there is an increase of 30.3%8 due to work for the boys and 18.5%9 for the girls in their discrepancy indexes.
Therefore, it is indisputable that work increases school discrepancy. But how can one explain that 50.5% of the boys and 41.3% of the girls who do not work are also behind in school? Why does work significantly affect boys more than girls? Other elements must be brought to the equation to better understand the kids' school discrepancy, in a more intense way for the boys, workers or not.
The relation between domestic activities and discrepancy (Table 5), is apparently of little significance for the boys, since their situation presents a variation from 46.4% to 53.6%, far lower than in the girls' case. Among the girls with problems with schooling delay, 80.5% do domestic activities.
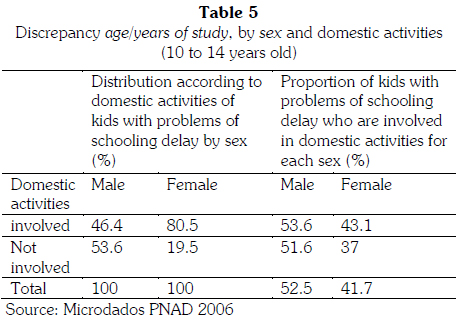
If work is a determinant factor in understanding boys' discrepancy, the domestic activities constitute a main differential for the understanding of the girls' discrepancy.
Table 6 ads to the previous information, dividing the domestic activities according to the amount of time spent. The indexes show that 37% of the girls who are not involved in domestic activities have problems with discrepancy. The number increases to 51.6%, when we consider those girls who spend more than 20 hours a week doing domestic work. Coincidently, this is the same percentage of boys who are not involved in any domestic activities.
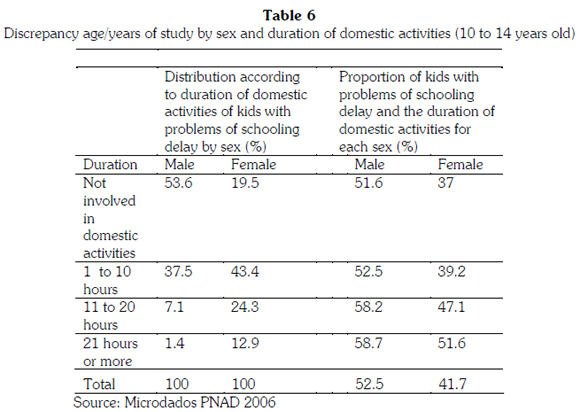
Table 7 presents information10 on the age of the first employment, also taking into consideration ages below the ones analyzed here. The number of boys, as well as girls, is greater at the age of 10 (left hand column). Note that the predominant age for boys entering the workforce is below the average age; as for the girls, we have the opposite, most of them enter the workforce after 10 years of age. The age of 10 coincides ideally with the end of the basic literacy process (according to the current system, it means going from elementary to middle school).
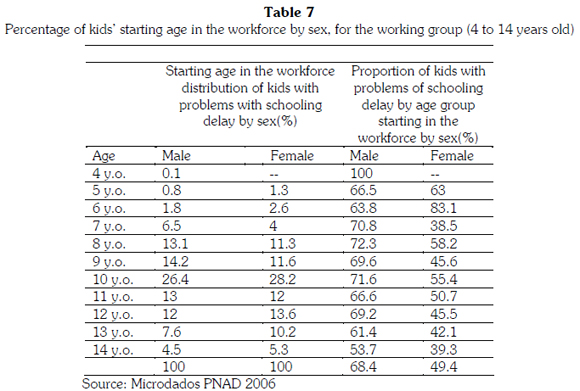
The discrepancy among the working group is greater than among the total group, going from 52.5% to 68.4%, among boys, and from 41.7% to 49.4%, among girls.
In Table 8, the element race is added to the presentation of the working group. The result is the presence of black kids a little bit higher in this group than in the general population and there is no difference by sex (left hand columns). The right hand columns show that 76.3% of the working boys with discrepancy problems are black. This index is 36% higher compared to the black population in general. As for the black girls, because of work the discrepancy increases 6.8%, considering the group with the same race. So, work added to race affects boys more strongly.
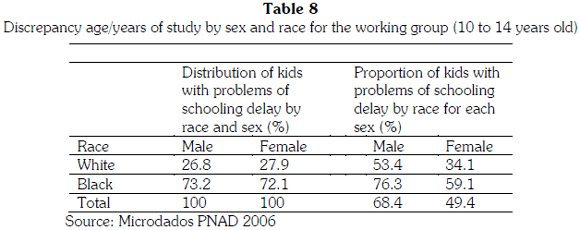
Table 9 presents information on domestic duties for the group of young workers.
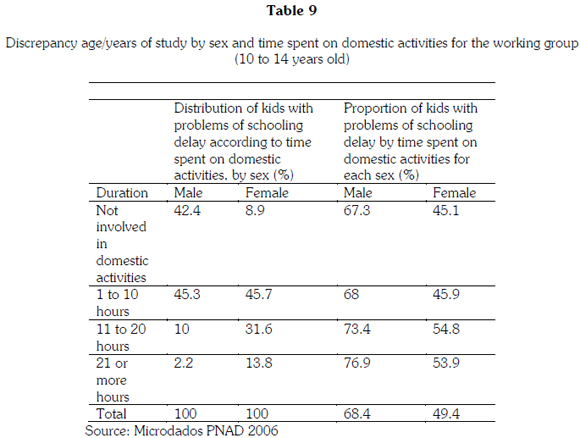
The column to the left indicates that a good portion of the boys with schooling delay problems are also not involved in domestic activities. This activity is part of the girls' routine, however, and it increases discrepancy: 45.4% of the girls who are behind in their studies work and are involved in domestic activities for more than 11 hours each week.
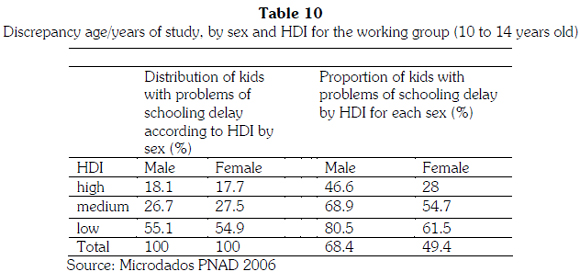
Table 10 contains information about the relation between discrepancy and HDI for the working group. It indicates a greater concentration of boys and girls with schooling delay problems in the areas with lower HDI. A possible explanation for the matter may lie in the different kinds of work developed in those regions: manual labor which requires a greater physical effort and harms school attendance even more.11
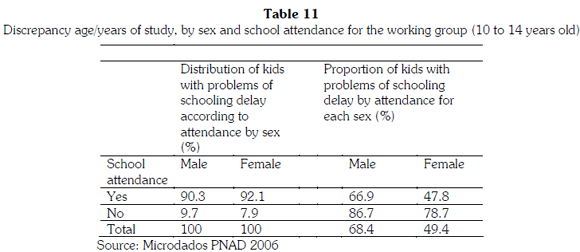
The association among work, school and discrepancy (Table 11) allows us to see that work does not impede school attendance, but it does increase discrepancy. Considering that 91.9% of the boys who work and 95% of the working girls attend school, it is possible to affirm that the percentage of kids with schooling problems increases proportionally for both sexes when they are working.
Statistic Modeling
The descriptive analysis previously presented enables us to have a fair idea of the effect of a number of variables (sex, race, age, HDI), when applied to the incidence factor associated to the discrepancy between age and years of study.
However, the analysis shown has some limitations. The main limitation is that the effect of the variables employed in the explanation of this incidence does not take into account the more comprehensive profile of the individuals. It is only possible to state that the work has some effect if we compare individuals of similar profiles that only differ in that a given individual is a worker. And this is only feasible by using a statistic analysis12, the techniques of which enable us to perform this comparison in a direct manner by means of the regression models. This explains the behavior that is expected of a dependent variable (for example, the incidence of the discrepancy between age and years of study), taking into account a set of independent variables (for example, sex, race, labor, etc.) (Corrar, 2007).
In this modeling, the following explaining variables were taken into consideration: sex (male/female); race (white/ black); HDI - State of residence, ranked as described above; weekly hours of work; and weekly hours of domestic duties.
Furthermore, it is important to consider the possible effects of interaction. For example, the fact that a person is male or black may lead to an increase of his or her possibility of falling behind at school. In this case, there is an interaction effect between sex and race.
Initially, a full model was adjusted with the effects of interaction between sex and the remaining variables. The significance of the effect was verified by means of Wald tests: in order to reach a final model, the interaction effects that were not significant were excluded. The quality of the adjustment was verified by means of the Hosmer and Lemeshow test (2000).
Two models were adjusted: the first one holds the labor and the domestic duties time ranking, whereas the second one considers the same variables, but with no ranking. Since it operates with ranked times, the first model enables us to evaluate the effect of these variables without the influence of possibly unequal values of time of labor or domestic duties13 (that is, people who spend much more time than others). The second model, in addition to confirming the results of the first one, enables us to carry out more detailed analyses with regard to these two variables.
Table 12 presents an estimate of the parameters, the relevant standard deviations, the Wald statistic, its degrees of freedom, the relevant P values, and an estimated rate of probabilities, a measure of discrepancy risk. The constant term refers to the following set of characters: woman, white, residing in high HDI states, who does not work and who is not engaged in domestic duties. The remaining effects establish differences with regard to this profile.
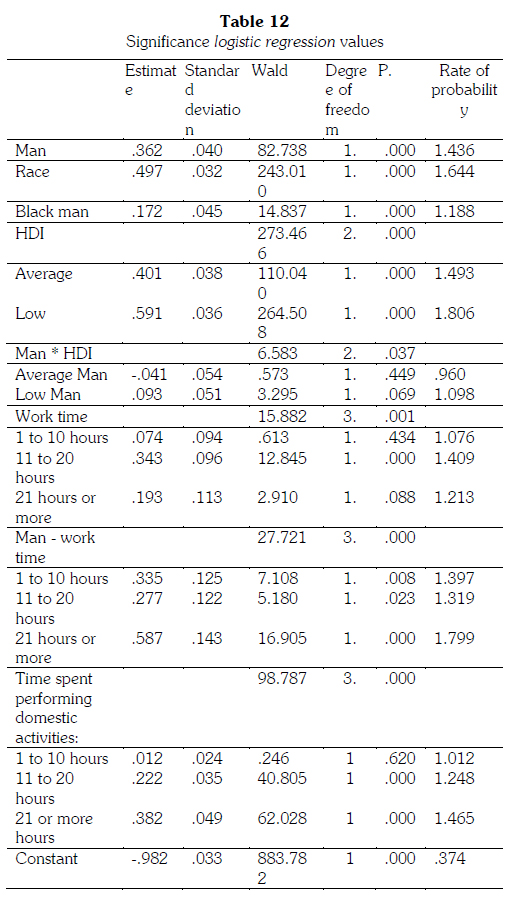
There is an effect of time spent performing domestic activities on the probability of falling behind at school (P<0.000), when other variables are under control. However, this can only be noticed in case there is a journey that exceeds 11 hours per week. When comparing two individuals for whom all variables are the same, except for the time spent performing domestic activities, in an elapsed time of 11 to 20 hours, the risk of falling behind at school experiences a 24.8% increase as compared to those individuals who do not perform any domestic duties, and in an elapsed time of 21 hours or more, there is a 46.5% increase in risk, as compared to those who are not engaged in these activities (See the column Rate of Probabilities in Table 12).
When considering the time spent at work and sex, a significant interaction was found (P<0.001). For women, when the work time is less than 10 hours, no significant difference was found in the expected probability of school discrepancy (P=0.434) as compared to those who did not work. Nevertheless, when work time exceeds 11 hours, the risk of school discrepancy is estimated to be 32.5% higher than in the case of a woman who does not work, provided all remaining variables remain unchanged. It should be noted that there was no significant difference in the variation of the risk when we considered women who worked from 11 to 20 hours, or more than 20 hours.
Compared with a woman who does not work, a man shows a staggered increase in the risk of school discrepancy: 43.6% for a non-working man, 116.2%14 for a man who works for a period of 1 to 10 hours, 167.0%15 for a man who works for a period of 11 to 20 hours, and 213.3%16 for a man who works for a period of 21 hours or more.
Upon analyzing only the group of working boys, we notice that in the first group (1 to 10 working hours) the probability of falling behind at school increases more than twofold, reaching 116.2% and going as high as 213.3% for the journeys of 21 or more hours. Comparing the group of working boys to the one of the working girls, the great difference between them indicates that, if labor is a factor that increases school discrepancy for both sexes, the damage is more serious to the boys.
It is interesting to observe the increase in the risk of school discrepancy for the boys who do not work, in comparison to the risk for the girls who do not work, when other associations are under control (that is, people with an identical profile as far as the remaining variables of the model are concerned): the risk increases 43.6% (only due to the fact that the subject is "a man"). This enables us to conclude that other factors - in addition to labor, domestic duties, race and HDI - are detrimental to the boys' schooling.
By the same token, the interaction between HDI and sex proved significant (P=0.037). Assuming the remaining variables are equal, with regard to a woman who lives in a high HDI state, the risk of falling behind at school increases by 49.3% for a woman from an average HDI region; 80.6% for another woman from a low HDI region; 40.6% for a man from a high HDI region; 105.9%17 for a man from an average HDI region; and 184.6 for a man from a low HDI region.
These results corroborate the thesis according to which the probability of falling behind is influenced by the economic status, as measured by the HDI, and reaches men and women differently. The lower the HDI of the region is the greater is the risk of school discrepancy for both sexes. Nevertheless, the comparison of the risk for the same HDIs indicates that the discrepancy is more significant for the boys, when the influences of the other variables are under control. Thus, we can affirm that the risk of falling behind in school suffers a 40.6% increase for the boys, simply due to the fact of being a male.
The effect of interaction between sex and race has also proved significant (P<0.001). If the remaining variables are under control, the risk of falling behind as compared to the white woman goes through a 64.4% increase for a black woman; 43.6% for a white man; and 180.5%18 for a black man.
As verified in the remaining interactions, the sex factor is also a determinant for understanding these results. Comparing white and black men to white women, we notice that the risk of discrepancy increases by 43.6% for the men, if all other variables are under control. However, when comparing the risk for groups of same race, black men present a risk of discrepancy that is three times higher in comparison to black women.
There was also a significant effect associated with domestic duties (P<0.001). Provided all other variables remained constant, we can say there is no significant difference in the risk of school discrepancy, when comparing people who do not perform any domestic activities with those who do, for a period of 1 to 10 hours (P= 0.620). Comparing those who do not perform any domestic duties with those who do, for a period of 11 to 20 hours, there is a 24.8% increase in the risk; for the group that performs domestic duties for 20 hours or more, as compared to the group that does not perform these tasks, the risk increases by 46.5%.
As previously mentioned, a second analysis was performed, in order to establish a quantitative relation between the time spent performing domestic activities and the time spent working. For technical reasons19, as model variables, the square root of the time spent working and the square root of the time spent performing domestic duties were used.
Table 13 presents the adjustment of this model. As well as in Model 1, the interactions between sex and work (P<0.001), sex and HDI (P=0.036), and sex and race (P<0.001) were considered significant, in addition to a new interaction effect: sex and the square root of the time spent performing domestic duties (P<0.001). The minus signal in this coefficient leads us to the conclusion that the effect of time spent performing domestic duties is more harmful for women than it is for men, in case there is the probability of the person falling behind at school. This can be observed more clearly in the analyses that follow.
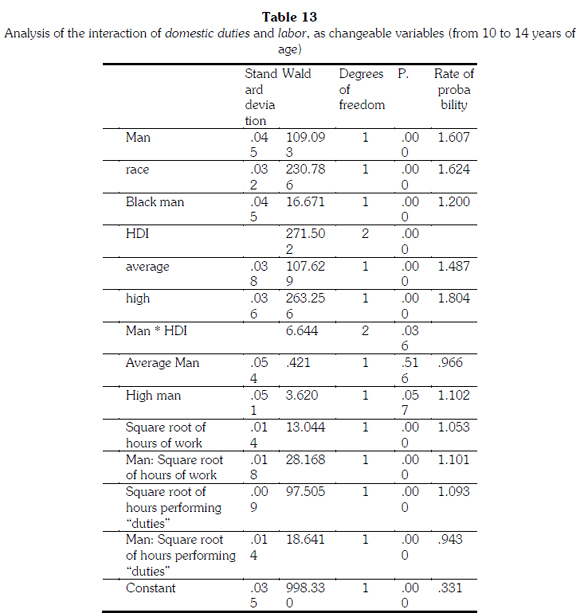
Charts 13a and 13b present the probabilities of discrepancy as foreseen by Model 2, which studies the effect of time spent performing domestic duties, whereas charts 13c and 13d enable us to evaluate the effect of the time spent working on this probability.
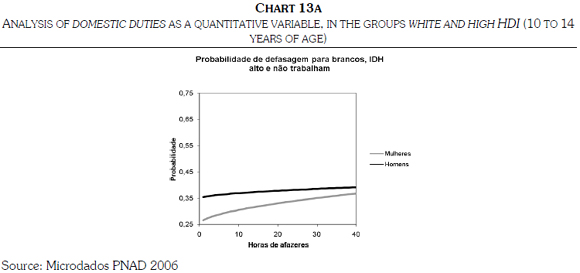
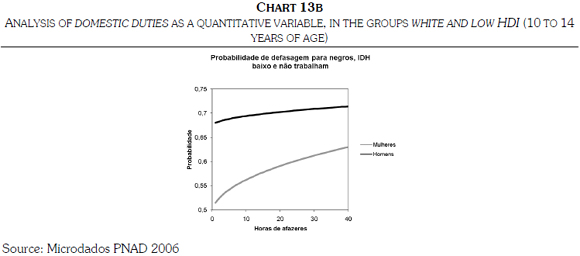
In Chart 13a, the proposed comparison is based on youth described as follows: non-working, white, residing in high HDI regions, that is, young people who are in a better position to minimize the effect of school discrepancy; chart 13b presents the same situation, focusing on the group of black young people who live in low HDI regions. The curves in the charts suggest that, although the probability of falling behind at school is initially higher for the boys who do not perform domestic duties, the curve pertaining to the girls is steeper, indicating that performing domestic activities is more harmful to girls than it is to boys. The probability of falling behind for white girls who perform domestic duties for 40 hours comes close to the initial value of probability of falling behind for boys who do not perform domestic duties (chart 13a) in high HDI states. In chart 13b, we notice the same harm done to the girls, as can be seen in the discrepancy curve. In the case of black boys, the initial probability of school discrepancy is already high, and the domestic duties factor does not influence it to a great extent. Considering that this is a group that does not work, the charts show that, in addition to labor, there are other factors that are harmful to the boys, mainly to black boys, who show a high probability of school discrepancy, even though they do not engage in any of the activities herein analyzed.
Charts 13c and 13d bring up the labor factor.
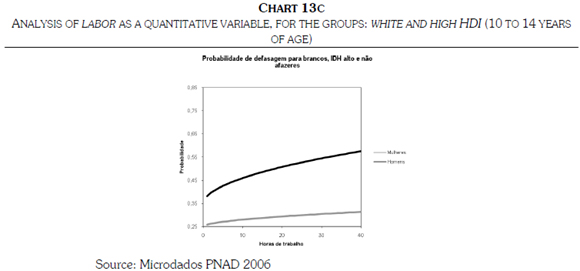
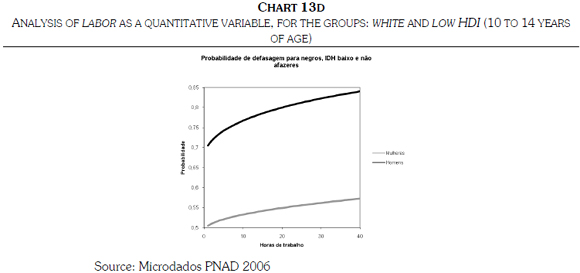
In this in case, the curve related to the boys is steeper, indicating more significant harmful effects to them when it comes to the probability of school discrepancy. The curve associated with the girls indicates a small influence of labor in school discrepancy. It should be noted that the curve associated with black girls is steeper (chart 26d) as compared to white girls.
Another important issue that must be brought to the reader's attention is the distance between the two curves. In the case of domestic duties, the curves tended to approach each other, that is, boys initially fall behind to a greater extent, but the domestic activities factor does more harm to girls, and therefore the distance between them diminishes. In the case of labor, as the damage is more significant for the boys, the distance between the curves tends to increase. In the comparison regarding race, black boys present the highest probabilities of school discrepancy, thus corroborating the idea that the race factor is important for the understanding of the results.
From the modeling it is possible to conclude, with a certain margin of safety, that labor increases the probability of school discrepancy mainly for the boys, whereas domestic activities have an effect on school discrepancy for the girls. Even though these activities act as aggravating factors, they cannot be considered as the only explanation or justification. With the control of the variables: race, HDI, domestic duties and labor, the difference between boys and girls is constant for the chosen index. This shows the need to consider other elements for the correct understanding of such discrepancy at school.
Boys, education and labor: how to explain?
The descriptive analysis of the data, in and of itself, would be enough to deconstruct the thesis that work justifies the boys' poorer performance at school: if, on the one hand, 11.1% of the boys and 5.9% of the girls work, on the other hand, 52.5% of the boys and 41.7% of the girls are falling behind in the studies. In other words, a large segment of the population in the 10-to-14 age bracket is falling behind at school, and only a small portion works (even though it is illegal to employ someone in this age bracket).
There is no doubt that working increases the possibility of school discrepancy. In the working people's group, 68.4% of the boys and 49.4% of the girls are falling behind. This shows that labor truly is a factor in causing the students to fall behind at school. However, this cannot be considered the only culprit for the differences between boys' and girls' schooling paths. This result is corroborated by the regressive analysis, which explores the issue of time at work, indicating that the longer the working hours, the higher the risk of school discrepancy for the boys. It is important to point out that the index of poor performance is high in the group that does not work, and once again it is more significant among young men than among young women.
The analysis of domestic activities indicates that this is predominantly a girl's activity. In the group analyzed, 54.5% of the boys as compared to 21.9% of the girls do not perform these tasks. The time spent in domestic activities also indicates very different results between the sexes: whereas 8% of the boys engage in more than 11 hours of domestic duties per week, the same index amounts to 32% for the girls. Using the results of the modeling, the data show that performing domestic duties for more than 11 hours will increase the risk of school discrepancy for the girls.
However, when comparing the damage caused to the student's school history, the harm done to the girls by performing domestic activities is less serious than the harm done to the boys by working. On the other hand, it is worth pointing out that in most cases both boys and girls are able to balance their school activities with their work. The school attendance for the working group decreases from 97% (total for that age bracket) to 92.4% (for the group that works), as far as the boys are concerned; and from 97.5% to 95.1%, as far as the girls are concerned. Thus, the labor factor causes a harder impact on the boys. A possible explanation - not explored in this study - is the existence of different types of work performed by men and women.
Another issue that must be highlighted is the number of girls who perform domestic activities, attend school, and, in addition to that, work; these girls, for all practical purposes, work three shifts. In the group of students who fall behind, 91.3% of the girls are in this category, as opposed to 59.2% of the boys.
Thus, school discrepancy - an ever-present reality in the universe of boys and girls - is associated with the activities they engage in, as much in the work scenario related to employment as in the domestic duties scenario. There is not necessarily a linear cause and effect relationship. Other factors influence this situation and must be looked at within a given context.
In Brazil, the color or race difference, polarized on whites and blacks, influences school performance. This assumption - constructed by a number of authors (Rosemberg, 2004, Beltrão 2002, Enriques, 2002; Hasenbalg, 1979) - was also corroborated in this study. Nevertheless, we must point out that the influence of color or race on students' performance must be understood taking also their sex into consideration, since the most serious harm is done to male students. In society as a whole, the association of sex and race results in even more serious oppression for black women; it gets worse if they are poor. This underprivileged situation is evidenced in several social spaces: job market, access to leadership positions, political representation, etc. However, in the analysis of the young Brazilians' schooling path, this study has shown that, in a specific age bracket and based on a given index, black girls come up with better results as compared to boys, as other authors have already pointed out. Hence, in the context of Brazilian schooling, poor black boys make up the group that faces more difficulties than any other group. If the race factor plays a part in the ranking of the worst results, this factor affects, to a much larger extent, the male students. We have sought, at all times, to identify the boys and young men at a disadvantage throughout their schooling path, so as to prevent a two-sided analysis that would treat the female and the male groups as intrinsically homogeneous and opposed to each other.
Understanding this complex picture of empirical data requires similar theoretical sophistication. Maybe that is why some studies, in spite of presenting information about this inversion due to sex in the educational field, predominantly highlight the race and social status differences, thus ignoring in their analyses the possible success of female students.
 One way or another, the patchwork of variables that influence the differences in performance between boys and girls calls for new possibilities of explanation. A path that is still not often taken in Brazil for this understanding is the analysis of the forms of masculinities built inside the classroom or within the limits of the school, and even with regard to the different expectations that families have regarding boys and girls. The school, especially, as a space of social construction, produces and reproduces masculinities and femininities, which are different depending on which race the individual belongs to. They may result from the actions of educators or from the relationships among peers. The manner in which these different expectations would affect the school performance of boys and girls, whether they are black or white, must still be established. It is being gradually analyzed by means of studies of qualitative nature for the most part (Silva, 2004; Brito, 2006; Pereira, 2008; Rosemberg, 2004; Carvalho, 2003).
The purpose of this article was to confront the prevailing opinion according to which the performance issues found among boys stem from factors that originate outside the school, especially their initiation in the job market. The results presented by the analyses developed herein, on the one hand, confirm that Brazilian boys face more difficulties throughout their schooling path, as measured by means of the discrepancy between age and grades of schooling. On the other hand, with regard to the main argument to justify this poor performance - the need to join the workforce - it has been established that this is a factor, among others, that adversely affects young men and young women's school life, increasing the discrepancy rate between their age and grades of schooling, especially among black boys who reside in poorer regions. However, how can it be explained that only one out of ten boys does work, while five are falling behind at school? In order to understand this fact, we must confront the discussion on the male roles and open the black box of the intra-school relationships, since the external factors fall short of achieving an explanation.
Bibliographic References
Beltrão, Kaizô, Acesso à educação: diferenciais entre os sexos. Texto para Discussão 879, IPEA, 2002.
Brito, Rosemeire. Santos. Intrincada trama de masculinidades e feminilidades: fracasso escolar de meninos. Cadernos de Pesquisa, vol. 36, n. 127, São Paulo, Fundação Carlos Chagas, 2006, pp.129-149.
Brasil. Pesquisa Nacional de Amostra de Domicílios - 2006. Notas Técnicas IBGE, 2006.
Bruschini, Cristina Trabalho doméstico: inatividade econômica ou trabalho não remunerado. Revista Brasileira de Estudos Populacionais, vol. 23, n. 2, São Paulo, jul./dez. 2006, pp.331-353.
Carvalho, Marília Pinto de. Sucesso e fracasso escolar: uma questão de gênero. Educ. Pesquisa, vol. 29, n. 1, 2003
__________. Mau aluno, boa aluna? Como os professores avaliam meninos e meninas. Estudos feministas, vol.9, n.2 , Florianópolis, 2001, pp.554-574.
__________. Estatísticas de desempenho escolar: o lado avesso. Educação e Sociedade, vol. 22, n. 77, Campinas-SP, dez. 2001, pp.231-252.
__________. No coração da sala de aula: gênero e trabalho docente nas séries iniciais. São Paulo: Xamã/Fapesp, 1999.
Corrar, Luiz J; Paulo, Edilson; Dias Filho, José Maria. Análise Multivariada: para cursos de administração, ciências contábeis e economia. São Paulo: Atlas/FIPECAFI, 2007.
Costa, Sérgio. A construção sociológica da raça no Brasil. Estudos Afro-asiáticos, vol. 24, n. 1, Rio de Janeiro, 2002, pp.35-61.
Ferraro, Alceu Ravenello. Gênero, raça e escolarização na Bahia e no Rio de Janeiro. Cadernos de Pesquisa, vol. 39, São Paulo, set./dez. 2009, pp.813-836.
__________. Gênero, cor/raça e escolarização nos Estados da Bahia e Rio de Janeiro: um experimento com base em micro dados do censo 2000. Reunião ANPED 30 anos, Caxambu-MG, 2007ª.
__________. Gênero, cor/raça e níveis de letramento em Santa Catarina e Alagoas: um experimento com micro dados do censo 2000. mimeo, 2007b.
__________. Género y alfabetización en el Brasil de 1940 al 2000: trazando la trayectoria de la relación. Anais da XVI ISA World Congress of Sociology, Durbam, South Africa, July, 2006, pp.23-29.
Hasenbalg, Carlos A. Discriminação e desigualdades raciais no Brasil. Rio de Janeiro: Graal, 1979.
Henriques, Ricardo. Raça e Gênero no sistema de ensino: os limites das políticas universalistas na educação. UNESCO, 2002.
Hirata, Helena. Divisão sexual do trabalho: o estado das artes. In: Hirata, Helena. Nova divisão sexual do trabalho? Um olhar voltado para a empresa e a sociedade. São Paulo: Boitempo, 2002.
Hosmer, David W.; Lemeshow, Stanley. Applied logistic regression. 2nd ed. New York, Wiley, 2000.
Kassouf, Ana Lúcia. O que conhecemos sobre o trabalho infantil? Nova Economia, vol. 17, n. 2, Belo Horizonte, 2007, pp.323-350.
Pereira, Fábio Hoffmann. Encaminhamentos a Recuperação Paralela: Um Olhar de Gênero. Dissertação de mestrado, Faculdade de Educação/USP, 2008.
Pinheiro, Luana et alii. Retrato das Desigualdades de gênero e raça. 3ª ed. Brasília, IPEA/SPM/UNIFEM, 2008.
Rocha, Sônia. Trabalho precoce: realidade social e desafio de política pública. Nova Economia, vol. 13, n.2, Belo Horizonte, julho/dezembro 2003, pp.61-80.
Rosemberg, Fúlvia e Freitas, Rosangela. Participação de crianças brasileiras na força de trabalho e educação. Educação e Realidade, vol. 27, n.1, Porto Alegre, 2002, pp.95-126.
Rosemberg, Fúlvia. Desigualdades de raza y gênero em la sistema educativo brasileno. In: Winkler, Donald y Cueto, Santiago. Etinicidad, raza, gênero y educacion em América Latina. Chile, PREAL, 2004.
__________. Educação Formal, mulheres e relações de gênero: balanço preliminar da década de 90. In: Bruschini, Cristina e Unbehaum, Sandra. Gênero, democracia e sociedade brasileira. São Paulo: Fundação Carlos Chagas, 2002.
__________ et alii. Mulher e educação formal no Brasil: estado da arte e bibliografia. Brasília: INEP/REDUC, 1990.
Schwartzman, Felipe; Schwartzman, Simon. Tendências do trabalho infantil no Brasil - 1992-2002. Brasília: OIT, 2004.
Scott, Joan W. Gênero: uma categoria útil de análise histórica. Educação & Realidade, vol. 2, nº 20, Porto Alegre, jul/dez de 1995, pp.71-100.
Silva, Nelson Vale. Expansion escolar y estratificacion educacional en Brasil. In: Winkler, Donald y Cueto, Santiago. Etinicidad, raza, gênero y educacion en América Latina. Chile: PREAL, 2004.
Unesco. Relatório de Monitoramento Global de EPT 2003/2004 educação para todos; Gênero e educação para todos: o salto para a igualdade. São Paulo: Moderna, 2004.
* Submitted for publication in March 2010, accepted in May 2010. This article presents part of the findings of Amélia Cristina Abreu Artes' doctoral thesis, defended at Faculdade de Educação - USP in 2009, under the orientation of Marília Pinto de Carvalho. Translated by Maria Luisa Prandina Rodrigues
** Doctor in Education, professor at Universidade Bandeirante de São Paulo. a.artes@uol.com.br
*** Tenured professor at Faculdade de Educação da Universidade de São Paulo (USP). mariliac@usp.br
1 This discrepancy can be measured in an interval of a year or so. Some publications, such as the Dicionário de Indicadores Educacionais MEC/INEP (2004), adopt a one-year discrepancy. However, as the Brazilian schooling system allows underage students to enroll the system, in order to build an indicator, it was decided to consider a two-year delay.
2Â The 11274/06 law established a nine-year duration for elementary school and modified the elementary school starting age at the age of six. As the present study deals with data from PNAD 2006, this change has not affected our analysis.
3Â Source: Atlas de Desenvolvimento no Brasil, 2000.
4Â The yellow and indian categories were not considered by the present study, given that they amount to 0.3% of the total population. The analysis of these categories thus demands a separate study.
5 The term "work" is used here to indicate paid activities in the formal or informal economies, undertaken both within the household and outside of it.
6Â Some of the tables presented below were verified according to the data presented on the IBGE's website where coherent results were found: Â Â Â Â Â Â Â Â Â Â Â www.ibge.gov.br/home/estatistica/população/trabalhadoreserendimento/pnad2006/tabbrasil.shtm
7 In order to present the relation between each of the variables used and the schooling discrepancy - defined from the relation between age and the number of years of study - the following tables are organized in two parts. The first two columns represent the percentage of students , out of 100%, who are behind in their studies within each variable studied (age, race, HDI, work and domestic activities); the third and fourth columns present the percentage within the variable "discrepancy"; the percentages thus cannot be added vertically. The last line of each column presents the percentage of children behind in school per sex.
8Â Calculation: 68.4-52.5/52.5 = 30.3
9Â Calculation: 49.4-41.7/41.7 = 18.5
10 Tables 7 to 11 explore the characteristics of the group of young workers. The first two columns present the percentages of children behind in school inside the chosen variable (age, race, domestic activites, HDI and school attendance), totalizing 100% of the chosen population, that is, young workers. The third and fourth columns show the percentage inside the discrepancy variable, and it cannot be added vertically. In the last line of these columns the percentage of kids with problems with school delay is shown according to sex.
11 As no differences between the sexes were observed, this question will not be explored.
12 Rinaldo Artes, who has a PhD degree in statistics from the University of São Paulo, has worked voluntarily, supporting the research and building the statistical model.
13 Moreover, possible non-linearities are automatically accommodated for.
14 calculation [exp (0.362+0.074+0.335) =2.162]
15 calculation [exp (0.362+0.343+0.277) =2.670]
16 calculation [exp (0.362+0.193+0.587) =3.133]
17 calculation exp (0.362+0401-0.041) =2.059
18 calculation exp (0.362+0.497+0.172) =2.805
19 Control of significant asymmetries between the variables time spent working and time spent performing domestic duties.
