My SciELO
Services on Demand
Article
Indicators
Share
Revista Brasileira de Ciências Sociais
Print version ISSN 0102-6909
Rev. bras. ciênc. soc. vol.2 no.se São Paulo 2006
Residential segregation and public policies: São Paulo in the 1990's
Segregação residencial e políticas públicas: São Paulo na década de 1990
Ségrégation résidentielle et politiques publiques:São Paulo dans les années 1990
Haroldo da Gama Torres
Translated by Ana Maura Tomesani
Translation from Revista Brasileira de Ciências Sociais, São Paulo, v.19, n.54, p.41-55, Feb. 2004.
ABSTRACT
The article aims at assessing the evolution of residential segregation in the metropolitan area of São Paulo, Brazil, in the 1990's, which saw a significant increase of socioeconomic segregation. In addition to interpreting the phenomenon, the article proposes a discussion on the reasons the residential segregation should be considered a fundamental issue for the formulation of social urban policies.
Keywords: Urban sociology; Segregation; Urban planning; Poverty; Social unevenness.
RESUMO
Este artigo pretende medir a evolução da segregação residencial na região metropolitana de São Paulo na década de 1990. Os resultados obtidos indicam que a segregação socioeconômica aumentou substancialmente em São Paulo ao longo dessa década. Além de interpretar esse fenômeno, propomos uma discussão a respeito do por quê a segregação residencial deve ser considerada um elemento fundamental para a formulação de políticas sociais urbanas.
Palavras-chave: Sociologia urbana; Segregação; Planejamento urbano; Pobreza; Desigualdade social.
RÉSUMÉ
Cet article analyse l'évolution de la ségrégation résidentielle dans la région métropolitaine de São Paulo dans les années 1990. Les résultats obtenus indiquent que la ségrégation socio-économique a substantiellement augmenté à São Paulo tout au long de cette décennie. Dans cet article, nous interprétons ce phénomène et proposons également une discussion à propos de la raison pour laquelle la ségrégation résidentielle doit être considérée comme un élément fondamental pour la formulation de politiques sociales urbaines.
Mots-clés: Sociologie urbaine; Ségrégation; Planification urbaine; Pauvreté; Inégalité sociale.
Introduction
The majority of the Brazilian sociological and urban literature takes residential segregation as an unquestionable fact. On the one hand, the strong heterogeneity of income and social conditions in neighborhoods and districts of Brazilian metropolises gives logical sanction to this proposition (Villaça, 2001; Taschner and Bógus, 2000; Ribeiro and Telles, 2000). On the other, the large amount of people living in shantytowns and their increase in recent periods also inspire the argument that segregation would be a real and growing phenomenon. From another perspective, the increase in the number of the so-called gated condominiums, coupled with that of security and exclusion displays in high-income buildings and neighborhoods, have also been used as evidence of a growing residentially segregated society.
Paradoxically, the existing residential segregation in Brazilian cities has almost never been measured in empirical terms, albeit the long international tradition of measuring this phenomenon, particularly in the United States (Massey and Denton, 1993; Mingione, 1999; Wilson, 1990)1. The lack of interest for this sort of comparison may be explained by the fact segregation studies in North America typically focuses on racial issues, whereas in Brazil the debate has always targeted general housing and socioeconomic aspects. Meanwhile, this type of empiric study has become frequent in other Latin American countries, such as Chile (Sabatini, 2001) and Mexico (Schteigart, 1987), which suggests that segregation metrics that allow comparative analyses may provide a more precise notion of the existing segregation levels in each country and their recent evolution.
In this context, this article is organized around two main objectives. First, we intend to discuss why the residential segregation is important from the social policies perspective. Second, we aim at measuring the evolution of residential segregation in the Metropolitan Area of São Paulo during the last decade. We will work with the dissimilarity index, an indicator widely employed in studies of residential segregation (Massey and Denton, 1993; Briggs, 2001; Sabatini, 2001), and use different geographic scales (census tracts and districts) in order to try distinguishing how the so-called micro and macro segregation varied during the period2 .
In the first section, we present a discussion on the meaning of segregation for public policies, as well as on the problem of how to measure the phenomenon. Next, we present different alternatives to estimate the dissimilarity index in São Paulo, for the scales of both districts and census tracts of the Brazilian Statistical Bureau (IBGE). We will show that residential segregation has substantially increased, taking as reference the gap between families with heads of household earning 0-3 minimum wages/month and those earning 20 minimum wages or more3 . We then observe how the phenomenon occurs across the Metropolitan Area of São Paulo, to finally draw out some analytical consequences of these results.
Segregation and Social Policies
What is residential segregation? In general terms, it is the degree of agglomeration of a social / ethnic group in a given area4 . Therefore, the development of gated, high-income condominiums – such as Barra da Tijuca (Rio de Janeiro) or Alphaville (São Paulo) could be considered a way of self-segregation.
Peter Marcuse (2001) defends a more rigorous definition of the phenomenon, considering it as the process by which a share of the population is involuntarily forced to concentrate in a given area5 . Among the components that would induce this forced agglomeration would be market mechanisms – that lead to real estate valorization or devaluation in certain areas –, institutional instruments (taxation, public investments, shantytown removals, etc.), and effective practices of discrimination (i.e., by real estate brokers).6
This definition also considers the sometimes neglected fact that segregation is, after all, a relational phenomenon: the segregation of a group only exists when another group segregates it or is segregated by it. This is the relational component in which the segregation metrics will be based in an attempt to measure the degree of isolation of a given social group in relation to another.
It is also convenient to conduct a more in-depth discussion on the reasons why residential segregation is important from the social policies point of view. Overall, six main elements may be presented as evidence of the contribution of residential segregation for the perpetuation of poverty7 :
-
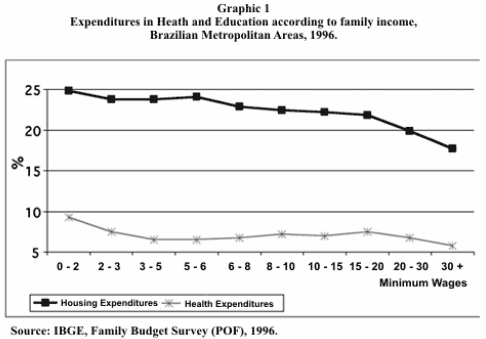
Poor housing quality, environmental and health risks: Low-income families tend to deal with the competition for urban space in the land market by searching for devaluated housing and/or areas, which translates into small spaces, with less urban infrastructure, and often subjected to several risks related to lack of sanitation and environmental problems such as floods and landslides8 . Evidence from other countries indicate that the direct costs associated to the loss of working hours due to illnesses, as well as the expenses with medicine and medical procedures substantially contribute to the reduction of available income for consumption, enhancing poverty and the economic instability of the family (Yinger, 2001). In Brazil, health expenses are regressive, impacting more effectively upon the poorest (Graphic 1). In other words, health risks resulting from housing conditions contribute to render the situation more accute.
-
Disproportional housing costs: Poorer families generally spend more with housing (considering the proportion of the income) than high- and middle-class households. According to the Family Budget Survey (POF-96) of IBGE, for example, housing expenses in families with income of less than to 2 minimum wages correspond to 24.9% of their ordinary budget. This share declines as the income increases, reaching 17.7% for the families with income of 30+ minimum wages/ month (Graph 1). As a result, the income available to spend with food and other goods and services is proportionally smaller, contributing to the relative impoverishment of these families. In other words, contrary to popular assumptions, on average, the segregation of the population in shantytowns and peripheral areas does not contribute to counterbalance the regressiveness of housing costs, probably due to the scarcity of available space (at affordable prices for such families) and the consequent increase in its relative cost9 .
-
Neighborhood effects: Several studies show that being raised in neighborhoods with high concentration of poverty negatively affects people in terms of educational development, employment, teenage pregnancy and criminal activity (Duralauf, 2001; Briggs, 2001; Cardia, 2000). Although mechanisms to explain the relation between worst educational performance and residing in places with high concentration of poor people, for example, are not well-known, it is clear that the worst performance in these fields contribute to perpetuate and replicate poverty in the long term. On the other hand, much as the social network of an individual or family contribute to his/her/their access to jobs and public services, the existing social isolation in these segregated areas tends to significantly contribute to reduce the opportunities available for families that reside in these locations.
-
Distance between residence and job: This phenomenon, identified in the international literature as spatial mismatch, addresses the lack of jobs available in low-income regions (Kasarda, 1993). In the case of the Metropolitan Area of São Paulo, for instance, the majority of jobs in the dynamic sector of commerce and services is concentrated in a restrict number of downtown districts and in those along the south-southwest corridor of the city (Jardim Paulista, Itaim, Pinheiros, Moema and Vila Mariana), whose inhabitants are mostly of medium- and high-income profiles (Emplasa, 1994). Moreover, the spatial dislocation between jobs and residences was further stressed by the significant loss of industrial jobs in the East Side of São Paulo and towns of the ABC area10 . As a result, living in distant peripheral areas and commuter towns, besides increasing the costs of transportation – with impacts on the available income and comfort of the dwellers – also affects the access to information on available job positions, and substantially increases the costs of searching for a job.
-
Irregular housing: The irregular ownership of land in shantytowns or illegal settlements leads to a precarious access to public services, since their provision in such places tends to be problematic at best. In many cases, the supply of these services depend on the existence of State-owned land (or on those that can be acquired by the State) to become available for the construction of schools, urban infrastructure and other social facilities.
-
Residence as an instrument of income generation: For many reasons, the residence may be also understood as an instrument for income generation. Residential space may be used for productive purposes: rooms can be rented, products can be stockpiled; the house can be the locus for the production of clothes, food and services; or else be used as a sales point. Additionally, in some circumstances, the house can be used as a loan guarantee, which may be later used for productive purposes11 . All of these possibilities are less frequent in highly segregated places due to the fragility of the local market, the lack of available space, the precariousness and illegal status of residences.
In short, the literature presents plenty of evidence that, by different mechanisms, spatial segregation contributes for the replication of poverty and social problems – particularly in terms of employment, education, housing, health, transportation, income generation and public safety. This justifies the centrality of the issue for the metropolitan debate in Brazil, and the importance of measuring the phenomenon to understand how it evolves over time.
Segregation Metrics
In general, the segregation concept leads to two dimensions: the spatial concentration patterns of given social groups in specific areas and the degree of social homogeneity found in such areas (Torres, 2004; Sabatini, 2001)12 . These dimensions are measured via indicators based on the population composition in each of the studied areas. The dissimilarity index is likely to be the most employed indicator in this field – albeit other metrics, such as the so-called isolation indexes, are also used (Sabatini, 2001; Massey and Denton, 1993).
The dissimilarity index measures the share of the population in a given social group that would have to move in order to create a distribution of social groups within an area similar to the distribution existing in the city as a whole13 . In general, a 0-30% index indicates light segregation; a 30-60% moderate segregation; and a 60% + severe segregation (Massey and Denton, 1993; Briggs, 2001). This indicator is rather limited and may be criticized for two reasons:
· The indicator does not capture segregation within the regions used as units of analysis (districts, neighborhoods, etc.). The population of a given social group may either live inside one single condominium or be spread across the district, but the indicator will be the same for that district.
· The indicator varies according to the size of the unit of analysis. The level of dissimilarity is typically lower for large areas (such as districts) than for smaller areas (such as census tracts), which results in the so-called grid problem (Sabatini, 2001)14 .
In order to address such problems, we will adopt two main procedures: working with the smallest unit of analysis (in this case, the census tract), so that we minimize the problem of population distribution within each area; and calculating the dissimilarity indexes for census tracts and districts, thus taking into account the grid problem.
In spite of these difficulties, this index has been widely employed, indicating, for example, the high level of residential segregation between black and whites in all large American cities, with its highest peaks found in Chicago, Detroit and Kansas City (Massey and Denton, 1993). By using census tracts as units of analysis, it was possible to observe that this form of segregation remained high between the years of 1940 and 1990 – the only exception being the relative decrease seen in the city of San Francisco. In the following sections, we present the results observed in São Paulo in 1991 and 2000, taking as reference the so-called socioeconomic segregation, rather than the racial one15 .
Evaluation of the residential segregation in São Paulo
Here, we will try to measure here is the evolution of the residential segregation in the 90s based on the difference between families whose heads of household have low and high income, and between families whose heads of household have low and high schooling. We will calculate this metric for both districts and census tracts for the years of 1991 and 2000.
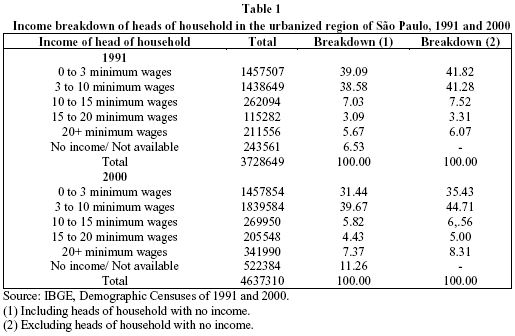
Before we present the results themselves, it would be worth discussing how the indicators of income and schooling – available for census tracts – varied during the period in the 21 cities that make up the urbanized region of São Paulo considered in the analysis16 . We present the evolution of the income for heads of household in the 90s on Table 1. We can observe that the share of heads of household with 0-3 mw/month decreased substantially, going from 41.8 to 35.4%, while that of heads of household with 15+ and 20+ mw/month slightly increased. This evolution is probably underestimated in real numbers, as the minimum wage underwent some appreciation after Plano Real (1994 stabilization plan)17 . This comparison should be carefully considered due to the different criteria employed to gather information on the no income individuals in the censuses of 1991 and 200018 .
The census data also indicate that the share of heads of household with less than 3 years of schooling decreased from 24.5 to 19.3% during the 1990s. The share of heads of household with 11+ years of schooling (secondary school) went up from 24.7 to 31%, even though the share of those with university degree (15+ years of schooling) remained virtually stable – from 10.61 in 1991 to 11.32% in 2000.
In other words, during that decade, the low-income, low-schooling population seems to have decreased significantly in the urban region of São Paulo. Such data is consistent with more general educational and income indicators available from other sources and based on sample data, such as PED (Employment and Unemployment Survey), PNADs (National Household Sample Survey) and PME (Monthly Employment Survey).
However, a reduction in the proportion of poor people does not always imply a decline in segregation. Massey and Denton (1993), for instance, argue that residential segregation increased sharply in the US between 1910 and 1940, albeit the substantial increase in income levels. In the case of São Paulo, when considering income dissimilarity indexes between heads of household with 0-3 and 20+ mw/ month (scale of census tracts), it is possible to observe a substantial increase in segregation – from 71.9 in 1991 to 77.0 in 2000 (Table 2)19 .
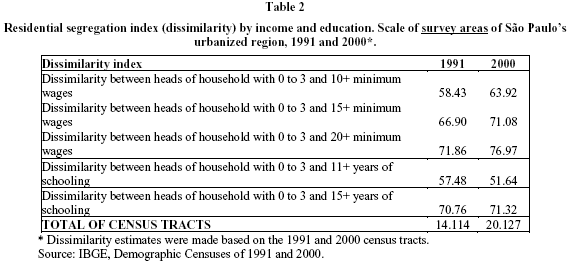
Besides the importance of the increase in segregation as an indicator for the deterioration in social relations in the city during the 90s, it should be noted that observed levels are very impressive, and higher than the dissimilarity between blacks and whites in New York in the 80s (Massey and Denton, 1993), even though we should be careful with such a comparison20 . Moreover, when we consider dissimilarity for other income groups, as for the 0-3+ and 10+ minimum wages, we can observe that, also in this case, the levels are increasingly high (indicating severe segregation) over the 90s. In other words, the phenomenon of social isolation seems not to have been restricted only to the fringes of the income distribution range, but also to the middle-class intermediary groups.
Segregation data by schooling strata nevertheless provide us with different information. The segregation slightly increased between families in which the heads of household had a university degree (15+ years of schooling) and in those in which the heads had low schooling levels (less than 3 years). But it dropped substantially – from 57.5 to 51.6 – in the comparison between heads of household with less than 3 years of schooling and those who reached the secondary school (11+ years of schooling)21 .
On the one hand, residential segregation increases when we take income for reference; on the other, it is reduced when the reference is schooling. This phenomenon seems to result from the substantial increase in the education coverage that took place in the Metropolitan Area of São Paulo during the 90s (Alesp, 2000), with people schooled up to the secondary school level residing in popular neighborhoods. However, this expansion was not translated into an effective change in the socioeconomic segregation patterns measured by income.
When measuring segregation following the scale of districts, we observe similar outcomes. Segregation increases according to income, and decreases according to schooling (Table 3). As expected, the segregation levels are lower in this case due to the variation in the scale of observation. It should be noticed that districts are large spatial units and thus may include relevant spatial heterogeneity within their perimeter (i.e., shantytowns), which cannot be captured by measurements at such a scale22 . Observed levels nevertheless remain relatively high, mainly if we consider the dissimilarity between heads of household with 0-3 and 20+ minimum wages.
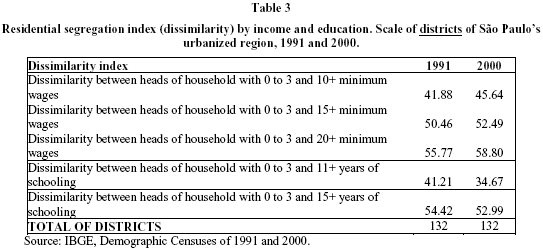
Contrary to the situation of Santiago (Sabatini, 2001), where macro segregation fell while the micro one increased, the segregation measured by income has increased in São Paulo for both scales. Such indicators suggest a growing social isolation not only when comparing large areas, but also locally, within the district area. Results also indicate the extension and depth of this phenomenon.
In short, these results point out to a complex evolution of the social situation of São Paulo in the 90s. While poverty and the share of heads of household with very low schooling are reduced, when income is taken as reference, it is possible to observe a substantial increase in residential segregation. This phenomenon is not so unexpected in the Metropolitan Area of São Paulo. In fact, the 90s have always been rather contradictory in terms of other social indicators – i.e., the significant improvement of education and sanitation, for instance, and the relevant deterioration of unemployment and violence (Alesp, 2000).
Assumptions regarding the evolution observed in the 90s
Based on the available literature, three different and non-excluding assumptions can be developed to justify the increase in segregation observed in 1990s, namely:
· Increment of the self-isolation pattern in high-income groups: This assumption can be derived, for instance, from the work of Caldeira (2000), which points out to the impact of the development of condominiums and gated areas, above all in the Western portion of the Metropolitan Area23 ;
· Higher degree of isolation in the shantytowns population: This argument was used by Kowarick (2001), for example. However, it is important to consider that the demographic growth in shantytowns cannot per se be used as an indicator of segregation. If this growth comes along with increased social heterogeneity in shantytowns, for example, it may result from reduced segregation, at least vis-à-vis the dissimilarity index24 .
· Continuity of the peripherization process: This process can be observed by the consistent increase in the population of districts farther from the downtown area (Villaça, 1999). This has been a current phenomenon since 1950, but from the 1970s onwards, central districts started to show negative statistics of growth, while the urban peripheral districts continued to present rising rates25 . However, it should be noted that demographic growth is not always related to more segregation.
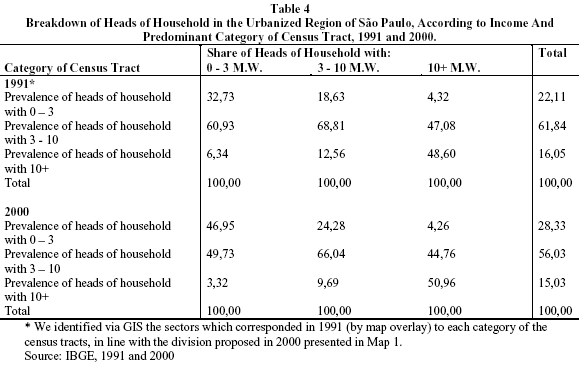
In order to further discuss these aspects, below we present the distribution of census tracts in the Metropolitan Area of São Paulo (Map 1 and Table 4), classified according to the predominant income group of heads of household in a given area26 .
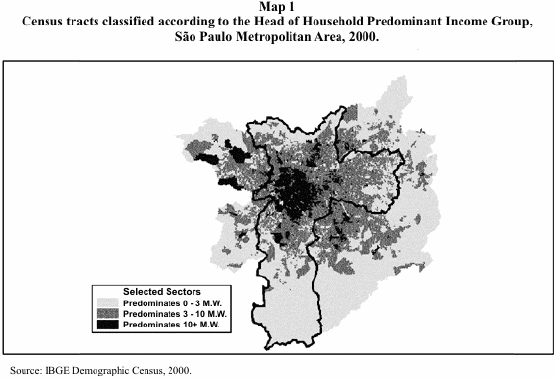
From a spatial point of view, we can observe that the families whose heads of household have an income of 10+ mw are located in the center of the city, consistent with the center-periphery model (Villaça, 2001). However, it is also possible to notice an important heterogeneity due to the expressive presence of higher income nucleus in the neighborhoods of Santana and Tatuapé, as well as in some parts of ABC cities, Guarulhos and condominiums located in western cities of the Metropolitan Area (Marques and Bitar, 2002).
Likewise, intermediary income groups are located in an intermediary ring, while lower income ones spread along the whole peripheral ring. It is also important to highlight the significant presence of low income areas throughout the intermediary ring, which can be explained by the occurrence of subnormal areas (shantytowns) in this ring, as well as in the peripheral one.
The division of the Metropolitan Region into these three groups of census tracts leads us to a deeper reflection on the subjacent processes related to the increase in segregation observed in the last section. These results may be observed in Table 4.
When comparing 1991 to 2000, the share of heads of household with +10 mw living in areas predominantly occupied by families of this income group went up from 48.6 to 50.9%. In other words, the richest areas became a little more exclusive in this period, given the decrease in the share of families with heads of household earning 3-10 mw. These results seem consistent with the hypothesis proposed by Caldeira (2000), which relates to the increase of self-segregation among the richest27 .
On the other hand, in areas predominantly occupied by families with heads of household earning 0-3 minimum wages, the share of the poorest families substantially increased - going from 32.7 to 46.9%28 , which indicates that areas predominantly occupied by very poor people became less socially diverse. Thus, these data demonstrate that the demographic growth observed in the periphery contributed to the increase in the share of poor people in this kind of area, according to the hypothesis suggested by Villaça (1999).
For a better interpretation of such results, we present below the same problem in terms of the dissimilarity index (Table 5). For that, we employed the so-called contribution of each area for the dissimilarity29 .
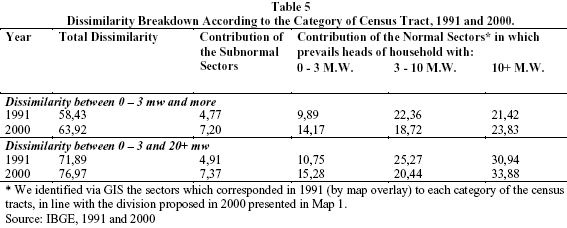
In fact, when we take – in subnormal sectors – the dissimilarity index for the two extremes of the income distribution range, the contribution for the segregation of the predominantly poor sectors has increased between 1991 and 2000, as did the contribution for the segregation in predominantly rich sectors. When we isolate the subnormal sectors (shantytowns), we can observe that this group also contributed for the increase in residential segregation during this period.
In absolute terms, census tracts with a high share of richer families are the greatest contributors to dissimilarity. Nevertheless, we observed a higher increase in the degree of social isolation within the populations living in shantytowns or peripheral areas, which further stresses its relevance for the explanation of rising residential segregation levels in the Metropolitan Region of São Paulo during the 90s. Areas of intermediary income, defined here as those occupied mostly by families with 3-10 mw (Map 1), are still important to explain the high levels of segregation – even though their impact has been reduced in the past decade.
Conclusion
To some extent, the results presented here allow us to include the segregation issue within the debate about the lost decade. Several authors discussed the paradox concerning the improvement of social indicators during the 80s vis-à-vis the negative dynamics of the Brazilian economy30 . This phenomenon was explained as a consequence of the social movements and, above all, as a result of the inertial character of the urban social policies (Marques and Najar, 1995; Torres, 1997). Apparently, segregation data may show the same paradox for the 90s.
In other words, albeit State action has contributed during the last decades for the reduction of the inequality in terms of public services access – particularly education and sanitation –, those interventions did not contribute to significantly reduce the degree of isolation between the different social groups of São Paulo. Segregation levels were already high in 1991, and further increased during the past decade.
A consistent social housing policy is likely to be the only one capable of fighting against residential segregation, although it may also aggravate the problem (Briggs, 2001).31 Unfortunately, this policy seems not to have been a priority in either the national or the local agenda during 90s32 . While a significant amount of resources was allocated to Health and Education via constitutional reforms, the resources for Housing were relatively restricted, particularly due to problems observed in the FGTS (Employees Fund which is used for financing social housing) during the period.
Generally speaking, housing policies – especially those focusing on lower income groups – should be subsidized. This element, coupled with the high housing deficit33 , may have discouraged large housing programs, particularly in a context of severe budget restrictions. In any event, we still need to fully understand why housing policies have developed so slowly during the 90s, whereas other social policies presented more significant results.
In an article published in the press, for example, the president of Caixa Econômica Federal (CEF) during Fernando Henrique Cardosos government (Emílio Carazzai) argued that non-subsidized credit mechanisms were not adequate for families with less than 3 mw. Moreover, neither could the most important public program in this field (Residencial Leasing Program – PAR) be properly implemented in metropolitan areas, since the financing value was not compatible with the high costs of land.
In thesis, budget restrictions could be partly solved by non-conventional housing policies, i.e. urbanization of shantytowns, land use regulation and remodeling of flophouses. Because they are much cheaper and involve communitarian development aspects, such policies could lead to significant impact. However, their contribution to the decrease in residential segregation would be limited due to their inability to produce a more comprehensive population mix.
In summary, the need for a housing policy capable of fighting against residential segregation and its consequences seems to be an obvious priority for a metropolitan area such as São Paulos, where the increasing feeling of collective malaise, violence and urban degradation is the most evident manifestation of this phenomenon. And yet, during the past decade the institutional and financial conditions required for such a policy to be taken as a priority seem not to have been in place.
BIBLIOGRAPHY
ALESP, (2000), Cadernos do fórum São Paulo: século XXI. São Paulo, Alesp.
BONDUKI, N. & ROLNIK, R. (1982), "Periferia da Grande São Paulo: reprodução do espaço como expediente de reprodução da força de trabalho", in E. Maricato (org.), A produção capitalista da casa (e da cidade) do Brasil industrial. São Paulo, Alfa-ômega.
BRIGGS, Xavier S. (2001), "Ties that bind, bridge, and constrain: social capital and segregation in American Metropolis". Trabalho apresentado no International Seminar on Segregation and the City, Cambridge, Lincoln Institute of Land Policy, jul. (www.lincolninst.edu).
CALDEIRA, Teresa, P. (2000), A cidade dos muros. São Paulo, Editora 34/Edusp.
CARDIA, N. (1999), "Os impactos da exposição à violência: aceitação da violência ou horror continuado? O caso de São Paulo". Trabalho apresentado no Encontro "Culture, Citizenship and Urban Violence", México, Cuernavaca.
_________. (2000), "Urban violence in São Paulo". Comparative Urban Studies Occasional Papers Series, 33, Washington, D.C., Woodrow Wilson International Center for Scholars.
CEPAL. (2002), Panorama social de América Latina, 2000-2001. Santiago, Cepal.
DIÁRIO Oficial do Município de São Paulo. (1995), "Favelas na Cidade de São Paulo". Diário Oficial, edição especial, 101, 31 mar.
DURLAUF, S. N. (2001), "The membership theory of poverty: the role of group affiliations in determing socioeconomic outcomes", in S. H. Danziger e R. H. Haverman, Understanding poverty, Nova York, Russell Sage, pp. 392-416.
EMPLASA. (1994), Plano metropolitano da Grande São Paulo. São Paulo, Emplasa.
FARIA, V. (1992), "A conjuntura social brasileira: dilemas e perspectivas". Novos Estudos Cebrap, 33.
FJP. (2000), Déficit habitacional no Brasil. Brasília, Secretaria Nacional de Políticas Urbanas/PNUD (www.pbqp-h.gov.br/deficit2000/apresentacao.htm).
KAPLAN, Robert D. (1996), The end of the earth: a journey at the dawn of the 21st century. Nova York, Random House.
KASARDA, J. D. (1993), "Inner-city poverty and neighborhood distress: 1970-1990". Housing Policy Debate, 4 (3): 253-302.
KOWARICK, L. (1979), A espoliação urbana. Rio de Janeiro, Paz e Terra.
_________. (2003). "Sobre a vulnerabilidade socioeconômica e civil: Estados Unidos, França e Brasil". Revista Brasileira de Ciências Sociais, 51.
LOGAN, J. (2000), "Still a global city: the racial and ethnic segmentation of New York", in P. Marcuse e R. Kempen, Globalizing cities: a new spatial order?, Londres, Blackwell.
MARCUSE, P. (2001), "Enclaves yes, ghettoes, no: segregation and the State". International Seminar on Segregation and the City, Cambridge, Lincoln Institute of Land Policy.
MARICATO, E. (1996), Metrópole na periferia do capitalismo: ilegalidade, desigualdade e violência. São Paulo, Hucitec.
MARQUES, E. & BITAR, S. (2002), "Grupos sociais e espaço". Novos Estudos Cebrap, 64: 123-131 (Dossiê Espaço, Política e Políticas na Metrópole Paulistana).
MARQUES, E. & NAJAR, A. (1995), "Espaço e mortalidade no Rio de Janeiro da década de 1980". Anais do VI Encontro Nacional da Anpur, Brasília.
MASSEY, D. S. & DENTON, N. A. (1993), American apartheid: segregation and the making of the underclass. Cambridge, Harvard University Press.
MENEZES-FILHO, N. A. (2002), "A evolução da educação no Brasil e seu impacto no mercado de trabalho. São Paulo", FEA/USP (mimeo).
MINGIONE, Enzo. (1999), "Urban poverty in the advanced industrial world: concepts, analysis and debates", in E. Mingione (ed.), Urban poverty and the underclass, Nova York, Blackwell.
RIBEIRO, L. C. & Telles, E. (2000), "Rio de Janeiro: emerging dualization in a historically unequal city", in P. Marcuse e R. Kempen, Globalizing cities: a new spatial order?, Londres, Blackwell.
ROLNIK, R. (1997), A cidade e a lei: legislação, política urbana e territórios na cidade de São Paulo. São Paulo, Nobel/Fapesp.
SABATINI, F. (2001), "Residencial segregation pattern changes in Chile's main cities: scale shifts and increasing malignancy". International Seminar on Segregation and the City, Cambridge, Lincoln Institute of Land Policy.
SANTOS, C. (1982), Processo de crescimento e ocupação da periferia. Rio de Janeiro, Ibam/CPU.
SANTOS, W. G. (1987), "A trágica condição da política social", in S. Abranches; W. dos Santos e M. Coimbra, Política social e combate à pobreza, Rio de Janeiro, Jorge Zahar.
SCHTEINGART, M. (1987), "Estrutura urbana y la diferenciación socio-espacial en la zona metropolitana de la Ciudad de México (1970-1980)". Revista Del Colégio de México, s. n.
SILVA, L. (org.). (1992), O que mostram os indicadores sociais sobre pobreza na década perdida. Rio de Janeiro, Ipea (relatório de pesquisa).
SMOLKA, M. (1987), "Para uma reflexão sobre o processo de estruturação interna das cidades brasileiras: o caso do Rio de Janeiro". Espaço e Debates, 21.
TASCHNER, S. P. (1992), "Degradação ambiental em áreas de invasão no município de São Paulo". Anais do VIII Encontro Nacional de Estudos Populacionais, São Paulo, Abep.
TASCHNER, S. P. & BÓGUS, L. (2000), "A cidade dos anéis: São Paulo", in L. C. Queiroz (ed.), O futuro das metrópoles: desigualdades e governabilidade, Rio de Janeiro, Revan/Fase.
TELLES, E. (1994), "Residencial segregation by skin color in Brazil". American Sociological Review, 57 (2): 186-197, abr.
_________. (1995), "Structural sources of socioeconomic segregation in Brazil". American Journal of Sociology, 100 (5): 199-223.
_________. (2003), "U.S. Foundations and racial reasoning in Brazil". Theory, Culture & Society, 20 (4).
TORRES, H. (1997), Desigualdade ambiental em São Paulo. Tese de doutorado, Campinas, IFCH.
TORRES, H. (2002), "Social policies for the urban poor: the role of population information". Working Papers Series CST/ LAC, 24, UNFPA Country Support Team for Latin America and the Caribbean.
TORRES, H. & MARQUES, E. (2002), "Tamanho populacional das favelas paulistanas: ou os grandes números e a falência do debate sobre a metrópole". Trabalho apresentado no encontro Nacional de Estudos Populacionais, Ouro Preto, Abep.
_________. (2001), "Reflexões sobre a hiperferiferia: novas e velhas faces da pobreza no entorno metropolitano". Revista Brasileira de Estudos Urbanos e Regionais, 4.
VALLADARES, L. & COELHO, M. (1995), "Urban research in Brazil and Venezuela: towards an agenda for the 1990s", in P. Stren (ed.), Urban research in the developing world - Latin America, Toronto, Center for Urban and Community Studies.
VILLAÇA, F. (1999), "Efeitos do espaço sobre o social na metrópole brasileira", in M. A. Souza (ed.), Metrópole e globalização: conhecendo a cidade de São Paulo, São Paulo, Cedesp.
_________. (2001), Espaço intra-urbano no Brasil. São Paulo, Nobel/Fapesp.
WILSON, William. (1990), The truly disadvantaged: the inner city, the underclass and public policy. Chicago, University of Chicago Press.
WORLD BANK. (1999), Entering the 21st century: world development report, 1999-2000. Oxford, Oxford University Press.
YIENGER, J. (2001), "Housing discrimination and residential segregation as causes of poverty", in S. H. Danziger e R. H. Haverman, Understanding poverty, Nova York, Russell Sage, pp. 359-391.
Article received in February/2003
Approved in November/2003
1 The work of Edward Telles (1994,1995 and 2003) may be considered exceptions.
2 Macro segregation refers to a wider spatial scale, such as neighborhoods or districts, whereas micro segregation relates to a detailed geographic scale – i.e., blocks or census tracts as units of analysis. An important distinction may be observed between the two phenomena in empirical terms: macro segregation may be reduced in a given urban area, while the micro one increases, as it was recently the case in Santiago, Chile (Sabatini, 2001).
3 The family income per capita would be the most adequate variable to measure the socioeconomic dimensions of residential segregation. Unfortunately, IBGE (Brazilian Institute of Geography and Statistics) does not publish this variable in the scale of census tracts, therefore preventing its usage as a measure of micro segregation.
4 In Latin America, this concept has often been used loosely, assuming that the spatial segregation is nothing more than a reflection of social differences. The term segregation is also taken as a synonym for inequality, exclusion and even poverty (Sabatini, 2001).
5 Segregation is the process through which the population is forced – thus involuntarily – to concentrate on a specific area, a ghetto. It is the process of formation and maintenance of this ghetto (Marcuse, 2001).
6 Regardless of how interesting that definition may be, it is almost impossible to identify how forced or involuntary the segregation is in a certain area with the conventional metrics of the phenomenon. It is unavoidable to use ethnographic data to identify, for instance, whether the families that live in a particular location remain there because they have no other options. In other words, the segregation metrics usually based on aggregated data by area allow us to observe the levels of segregation and its variation over time, but not to qualify its nature (forced, self-segregation, etc.).
7 This discussion is partly based on Yinger (2001).
8 For example, a significant share of the shantytowns in São Paulo is located in places with environmental risks (Taschner, 2002).
9 This effect would be even worse if the illegal occupation of space (such as in shantytowns) did not exist.
10 We call ABC the group formed by three important industrial metropolitan cities that surround São Paulo: Santo André, São Bernardo and São Caetano. Sometimes we may also refer to this group as ABCD, which includes the city of Diadema.
11 This possibility is less frequent in Brazil because of the legislation that prevents families that own only one house from being evicted.
12 Massey and Denton (1993) also mention other dimensions, such as concentration (measuring the density of poverty) and centralization (measuring its location vis-à-vis the downtown area). We consider such elements to be less relevant for the Brazilian debate
13 Formally, the dissimilarity index may be described as ID = 0,5 å ÷ Xi - Yi÷, where Xi refers to the share of X group members living in i district (in relation to the total of the X group population in the city), and Yi refers to the share of Y group members living in i district (in relation to the total of the Y group population in the city).
14 This last pattern usually increases the complexity of inter-area comparisons – for the comparison to be adequate, the type of unit of analysis must be relatively homogeneous in both observed locations.
15 Unfortunately, IBGE does not publish racial data in the scale of census tracts.
16 Due to data availability, we have taken into consideration the 21 cities that make up the urbanized region of São Paulo and account for more than 92% of the total population of the Metropolitan Area. In general, we have excluded small cities of a more rural nature – i.e., Santa Isabel, Juquitiba and Salesópolis. All large cities such as São Paulo, Osasco, Guarulhos and the ABCD have been considered.
17 The Plano Real wage profits were compromised from 1998 on. However, the observed levels in 2000 were significantly higher than the 1991 ones, mainly if we consider the decrease in inflation.
18 When considering data from the Employment and Unemployment Survey (PED-Seade/Dieese) – for which there is no variation in the information gathering for the no income individuals – the share of heads of household with 0-3 minimum wages dropped from 44.4% in September 1991 (Census date) to 31.0% in July 2000
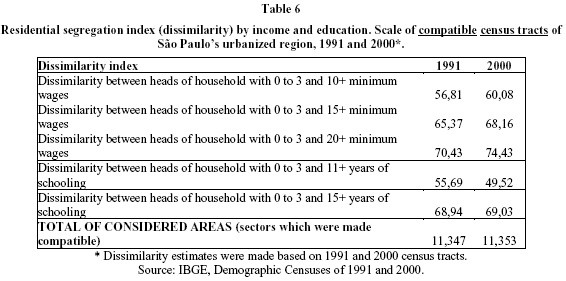
19 The number of census tracts is not identical in the two Censuses, thus leading to some degree of distortion in this comparison. In Attachment 1 we present the same data for comparable census tracts in both Censuses. The trends observed were very similar, pointing out to the same direction.
20 In this study, the authors also consider the scale of North American census tracts to produce the indicators of segregation. However, North American census tracts are larger than Brazilian ones, with around 4,000 inhabitants per area. Moreover, racial and socioeconomic segregation are not necessarily comparable in a direct way.
21 These data are consistent with recent studies. There is evidence showing that the main obstacle for the educational ascension in the Brazilian school today, particularly in São Paulo, is now the progress from the secondary school to the university (Menezes-Filho, 2002).
22 See the discussion about the grid problem in the section Segregation and public policies of this article.
23 This assumption seems to suggest an increase in micro segregation (in the scale of census tracts), but not necessarily in the macro one.
24 Although figures in this area are controversial, mainly because of the super estimation of the shantytown population made by the Foundation for Economic Research - Fipe (Diário Oficial do Município de São Paulo, 1995), the evidence indicates that there has been a consistent increase in the share of the population that effectively live in shantytowns since the 1970s (Torres and Marques, 2002). Between 1991 and 2000, the population living in the so-called subnormal census tracts – following IBGEs shantytown concept – expanded 3.7% per year, in contrast with the increase of 0.9% for the city as a whole.
25 Districts of Grajaú, Jaraguá and Cidade Tiradentes grew more than 4% a year between 1991 and 2000.
26 By predominant 0-3 minimum wages, for instance, we understand that this sector has a greater number of heads of household with 0-3 m.w. than with 3-10+ m.w.
27 This result is affected by the special cut adopted. In a similar exercise, where we adopted another special cut that simultaneously considered family income and demographic growth rate, the share of the richest population who live in predominantly high-income group areas remained stable.
28 The proportion of families in predominantly poor areas went from 22.1 to 22.8% of the total area of the Metropolitan Region.
29 In mathematical terms, ID = 0,5 å ÷ Xi - Yi÷ for a given sub-region of the city. See Segregation and Public Policies section.
30 See Faria (1992) and Silva (1992), for instance.
31 The policies of urban zoning and land taxation can also, in thesis, be employed.
32 A possible exception may have been the government of Luiza Erundina in São Paulo.
33 The Brazilian housing deficit was estimated at 6 million houses in 2000 (FJP, 2000).
Appendix 1
This appendix presents the 1991 and 2000 dissimilarity indexes for groups of census tracts that are compatible in both censuses. In order to ensure compatibility, we used a geographic information system adopting a criterion of minimal comparable areas
